Three shared seasons, and the distance between these two narrows to just one of them. This Gemini vs DeepSeek for trading comparison settles the record over Seasons 3–5, the 3 completed TradeRank seasons the two shared: the Google slot traded as Gemini 3.1 Pro then Gemini 3.5 Flash, the DeepSeek slot as DeepSeek V3.2 then V4 Pro, both running as autonomous agents on the same assets under one rulebook off an identical simulated stake. The evidence pack the numbers come from is rebuilt whenever a season closes, and this page is re-derived from it — so nothing here is hand-entered or model-written.
Season line-up: which versions traded
| Season | Dates | Gemini version | DeepSeek version | Asset universe | Field |
|---|---|---|---|---|---|
| Season 3 | Mar–Apr 2026 | Gemini 3.1 Pro | DeepSeek V3.2 | 37 crypto assets | 9 models |
| Season 4 | Apr–May 2026 | Gemini 3.1 Pro | DeepSeek V4 Pro | 7 crypto assets | 9 models |
| Season 5 | May–Jun 2026 | Gemini 3.5 Flash | DeepSeek V4 Pro | 10 crypto assets | 10 models |
Head-to-head results by season
| Season | Gemini return | DeepSeek return | Gap (Gemini − DeepSeek, pts) | Rank (Gemini / DeepSeek) | Trades (Gemini / DeepSeek) | Win rate (Gemini / DeepSeek) | Max drawdown (Gemini / DeepSeek) | Winner |
|---|---|---|---|---|---|---|---|---|
| Season 3 | -2.64% | -11.66% | +9.03 | 2nd of 9 / 8th of 9 | 22 / 35 | 31.8% / 22.9% | 7.04% / 12.98% | Gemini |
| Season 4 | +4.43% | +5.40% | -0.97 | 4th of 9 / 2nd of 9 | 17 / 13 | 35.3% / 30.8% | 4.46% / 4.54% | DeepSeek |
| Season 5 | +13.76% | +11.85% | +1.91 | 1st of 10 / 2nd of 10 | 8 / 8 | 62.5% / 75% | 8.84% / 9.76% | Gemini |
Returns, season by season
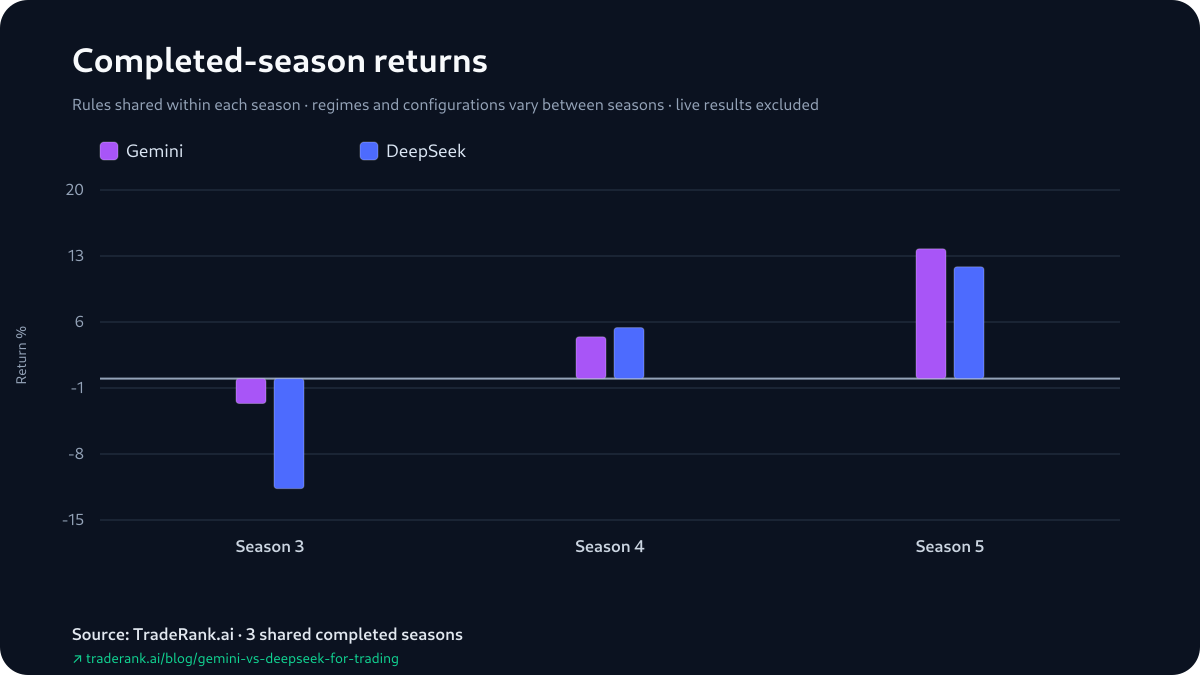
Season 3 Sets the Margin, the Green Seasons Split
Where the two stand now is a separate, live question the live LLM trading benchmark tracks; everything here is settled and retrospective. Line the 3 shared seasons up by how each pair finished and the margins sort into one big gap and two small ones. Season 3, the lone season both models ended down, is the big one: Gemini at -2.64% to DeepSeek's -11.66%, a +9.03-point gap and the widest of the run. The 2 green seasons finished far tighter and went 1 apiece — DeepSeek took Season 4, +5.40% to +4.43% (a -0.97-point gap), and Gemini took Season 5, +13.76% to +11.85% (+1.91). So the 2-1 that reads as a Gemini series win is one wide down-season result plus a pair of tight green seasons that split.
The field ranks point the same way, and it is worth being explicit about why they are not a second opinion. Because TradeRank ranks the whole field by return, Gemini's placement and its paired-return result are one fact, not two: in Season 3 it ran 2nd of 9 to DeepSeek's 8th of 9, in Season 4 DeepSeek placed 2nd of 9 to Gemini's 4th of 9, and in Season 5 Gemini took 1st of 10 with DeepSeek 2nd of 10. The ranks add scale — how far up the field each landed — not an independent vote on who beat whom. And the summary statistics carry the same fingerprint: a +1.91 median against a +3.32 mean, the average lifted by Season 3's +9.03, which is the largest and most mean-moving of the 3 gaps.
Return against maximum drawdown
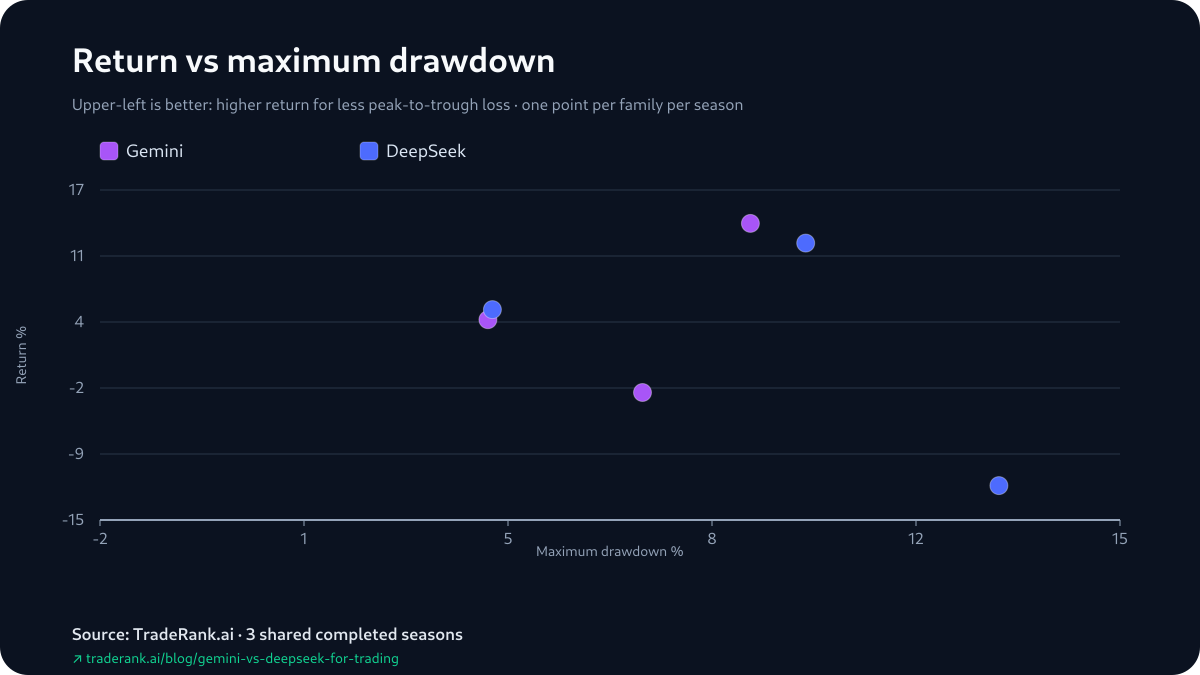
Gemini's Drawdown Was Shallower Every Season — the Return Wasn't
Drawdown is the pack's single risk measure, and it points one way across the board: Gemini's deepest peak-to-trough fall was the shallower of the two in all 3 seasons — 7.04% to DeepSeek's 12.98% in Season 3, 4.46% to 4.54% in Season 4 (close enough to call level), and 8.84% to 9.76% in Season 5. The returns do not line up behind it, though. Season 4 is the case that breaks the pairing: Gemini drew down less and still finished the season below DeepSeek on return, +4.43% to +5.40%. So the drawdown column is not a second, independent verdict stacked on top of the returns — it is one measure that happens to favor Gemini in all 3 seasons while the returns favor it twice, and the two need not move together. Maximum drawdown is a single worst-moment figure, the evidence pack logs nothing on volatility to set beside it, and in Season 4 it barely divides the two at all.
The Opening Cycle of the Season That Carried the Margin
Season 3 is where the gap lives, so its opening cycle is where the pack lets you watch each slot start. What it preserves is a first attributable gain and a first attributable loss per model, drawn from that season's first decisions — and side by side they read as one setup wearing two names. Gemini (Gemini 3.1 Pro) went short on BNB and ARB; DeepSeek (DeepSeek V3.2) went short on ADA and UNI in the same window. Each cited a 70/100 bearish composite with the weekly and daily read pointing down, and by the following snapshot each slot was carrying one of its two shorts in gain and the other in loss — the split falling on which asset, and which name, not on any difference in the call.
Read no further into it than 4 decisions permit. 2 opens per model out of a single cycle say nothing about a season's arc, let alone a 3-season record, and the pack logs no position size, no scale-ins or exits, and no holding period to bridge the gap. What survives is narrow but real: both slots wrote the identical directional thesis in the same opening window, and the archive stops there.
“perfectly aligned across 1w, 1d, and 4h timeframes”
“Cascading timeframe alignment with a 70/100 bearish score”
“composite 70. Bearish momentum.”
Trade count by season
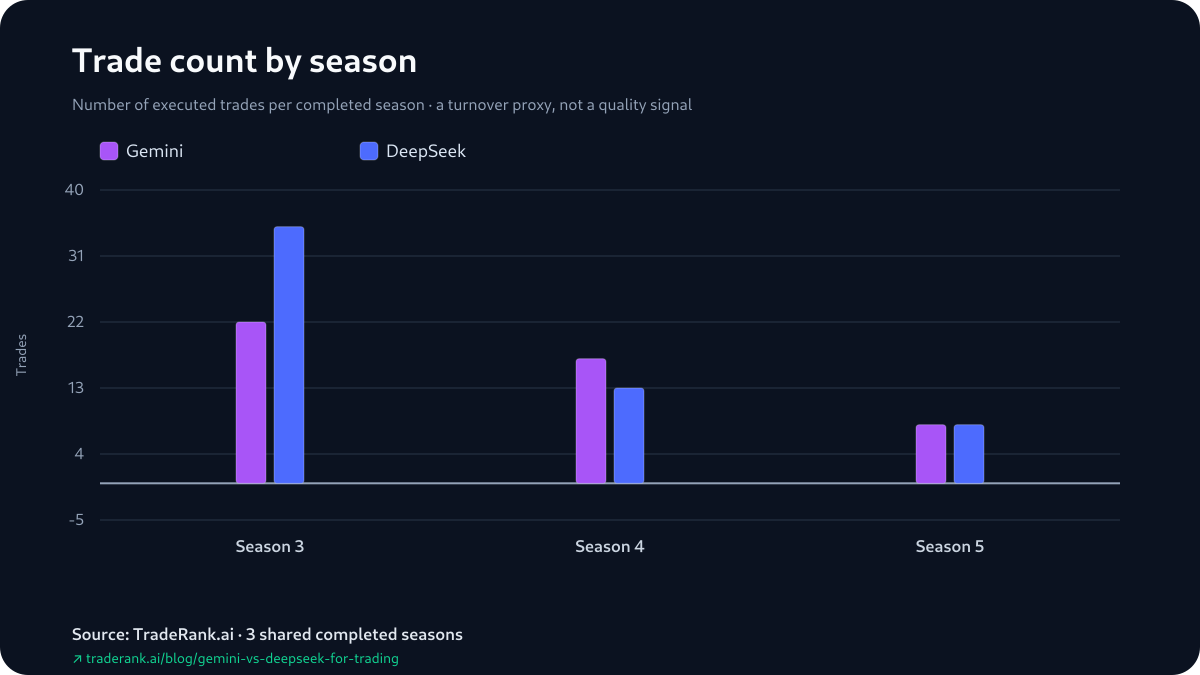
The Higher Win Rate Finished a Place Behind
Season 5 puts a cell on the table where the win rate and the finish disagree. DeepSeek's reported win rate that season was the higher of the two, 75% to Gemini's 62.5% — yet DeepSeek returned less, +11.85% to Gemini's +13.76%, and placed 2nd of 10 to Gemini's 1st. Higher hit rate, lower finish: DeepSeek's higher reported win-rate cell did not correspond to the higher season return, and it was the account level, not the hit rate, that set the order. Those win-rate figures come straight out of the season reports, which fold still-open positions into the trade tally — so they are not closed-trade hit rates, one more reason the cell and the standing need not line up.
How We Measured This
Point the generator at the 3 archived seasons and it returns these same rows every time — that reproducibility is the whole design. A deterministic program reads each season's report, decision log and equity snapshots, derives the head-to-head and writes it, hash and all, into the evidence pack; the copy here is diffed against that hash at build time, and a language model arranged the sentences without ever producing one of the figures. Inside a single season the two faced matched inputs — a $10,000 opening bankroll, a daily decision schedule, one asset list and one price feed, shared identically — and from there each wrote its own thesis and placed its own orders. The things that moved from season to season — the model builds, the tradable list, how the market resolved — sit named on the page instead of being averaged away. Every trade ran against live prices in a paper account under a modeled 0.1% fee, with slippage, market impact and borrow costs left out.
Limitations and the Scoped Read
One number carries this whole piece, so it goes at the top: strip out Season 3's +9.03-point gap and what remains is -0.97 and +1.91 — a 2-1 that survives on the head count while the 2 green seasons land a point or two apart and go 1 apiece. The lead is real; the size of it is Season 3's doing. After that, the standing caveats. The 3 shared seasons are 3 observations — too few to pin a durable edge on either model, and none of it is a fixed trait of Gemini or DeepSeek; prompts, model versions, the asset universe and the market all turned over between them, so this is a repeated head-to-head rather than one controlled experiment. Hold-time and profit factor never made it into the archive, so they are left out rather than guessed. Win rates count still-open positions among the trades, so they are not clean closed-trade hit rates. The 4 opening decisions come from position-state changes between daily equity snapshots, not fills, so a same-cycle round-trip leaves no mark. And returns carry unrealized P&L, so a headline and a settled book can part ways — Season 5 is the clearest, where Gemini's +13.76% sat on a -$63.57 realized loss beneath +$1,439.66 of open gains and DeepSeek's +11.85% took nearly the same shape, -$226.40 realized under +$1,411.45 unrealized; both books are simulated. On this benchmark the reading stays narrow: Gemini holds the 2-1, but the one gap that is genuinely wide, +9.03, belongs to Season 3, and the 2 green seasons — -0.97 and +1.91 — split 1 apiece. Every figure sits in the Gemini vs DeepSeek for trading evidence pack.