Read this as a settled record rather than a live scoreboard. It covers the 3 completed TradeRank seasons (Seasons 3–5) in which DeepSeek and Qwen both traded as autonomous agents, each starting from the same simulated bankroll under a single rulebook. Because every figure below is recomputed from a locked evidence pack — linked at the end — rather than authored by a language model, the page is rebuilt to match whenever a season closes. To see where the two sit in the race that is still running, follow the live LLM trading benchmark.
DeepSeek vs Qwen for Trading: The Season That Reversed It
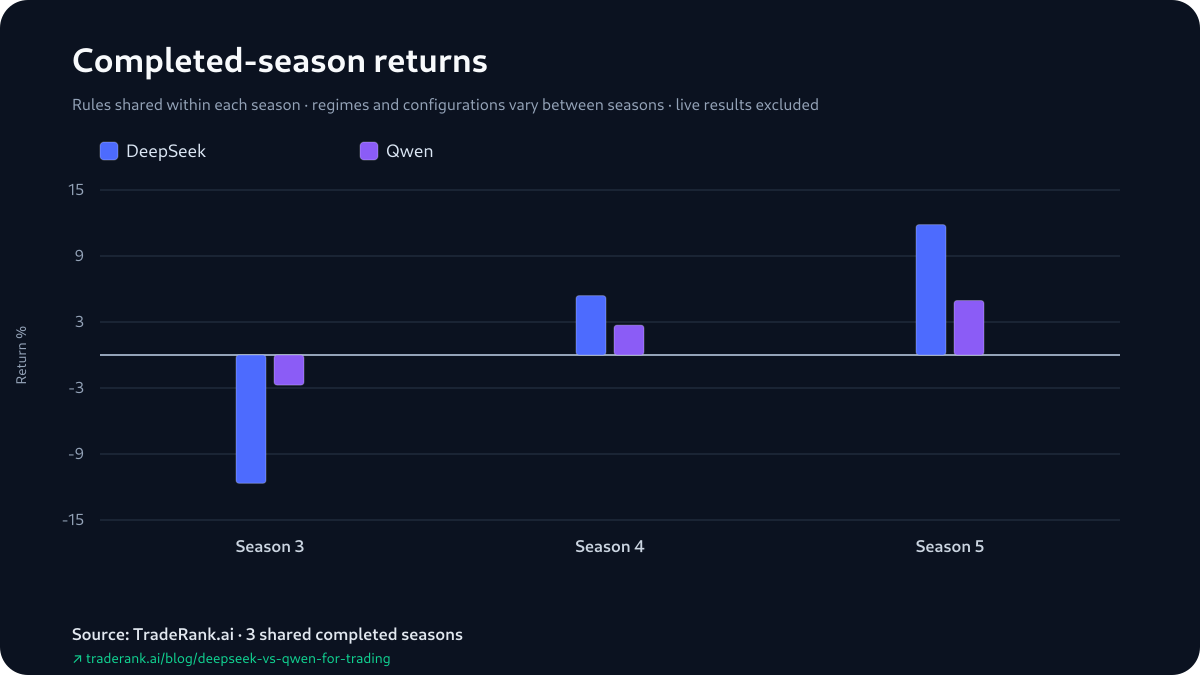
Play the 3 seasons in order and the standings cross exactly once. Season 3 belonged to Qwen, and not narrowly: Qwen finished 3rd in a 9-model field at -2.73%, while DeepSeek came 8th of 9 at -11.66% — an -8.93-point gap, DeepSeek near the foot of the table. After the opening season Qwen sat ahead in the head-to-head, and DeepSeek looked like the weaker trader.
Then the order turned over and stayed turned. In Season 4 DeepSeek climbed to 2nd at +5.40% while Qwen slipped to 7th at +2.72%, and the series drew level. In Season 5 DeepSeek held 2nd again at +11.85% while Qwen settled 5th at +4.95%, and the head-to-head closed 2-1 to DeepSeek. Read the ranks as a path: DeepSeek went 8th, 2nd, 2nd; Qwen went 3rd, 7th, 5th. The two swapped ends of the leaderboard after the first season and never swapped back.
That single crossover is the whole record. Qwen led after Season 3; DeepSeek squared it 1-1 in Season 4 and took its first lead, 2-1, after Season 5. The season winner reversed once — Qwen's opening win, then a pair of DeepSeek wins back to back — so this is a 2-1 that turned over exactly once rather than one that see-sawed, and it is worth knowing which kind you hold.
Head-to-head results by season
| Season | DeepSeek return | Qwen return | Gap (D−Q, pts) | Rank (D / Q) | Trades (D / Q) | Win rate (D / Q) | Max drawdown (D / Q) | Winner |
|---|---|---|---|---|---|---|---|---|
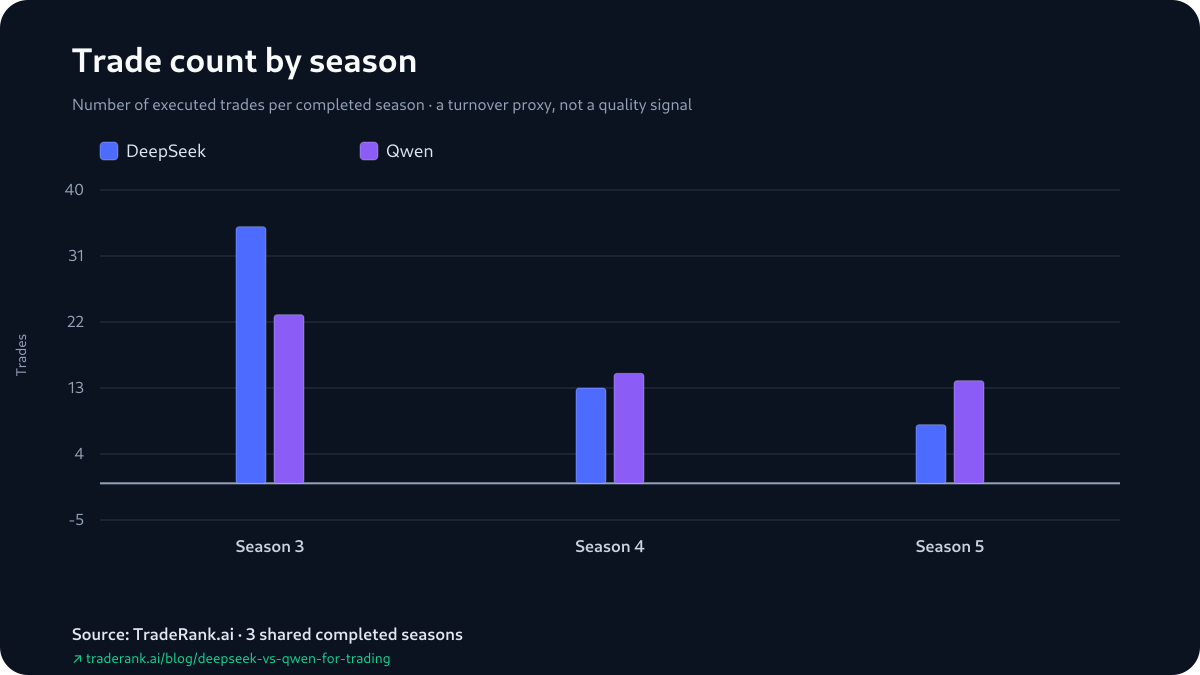
| Season 3 | -11.66% | -2.73% | -8.93 | 8th / 3rd | 35 / 23 | 22.9% / 30.4% | 12.98% / 7.96% | Qwen |
| Season 4 | +5.40% | +2.72% | +2.68 | 2nd / 7th | 13 / 15 | 30.8% / 26.7% | 4.54% / 3.41% | DeepSeek |
| Season 5 | +11.85% | +4.95% | +6.90 | 2nd / 5th | 8 / 14 | 75.0% / 50.0% | 9.76% / 7.99% | DeepSeek |
Returns, side by side
Three Return Summaries, One Fragile Lead
The three paired gaps — DeepSeek's return minus Qwen's — are -8.93 in Season 3, +2.68 in Season 4 and +6.90 in Season 5. Every headline summary in this piece compresses those same three numbers a different way, so when they agree they are not three independent votes but one body of evidence read three ways. The median is the middle gap, +2.68, and it is positive: DeepSeek. The mean of the three is positive too, but barely, at +0.22: DeepSeek again. And the simple tally of seasons won is 2-1: DeepSeek a third time.
What holds the mean down to a sliver is the size of Qwen's lone win. DeepSeek's winning margins were +2.68 and +6.90, but the margin in Qwen's Season 3, -8.93, is nearly as large as those two put together, so averaging all three leaves just +0.22. That is the real tension here: a clean 2-1 on the count and a clear median gap, resting on a mean so thin it sits closer to a tie than to a rout. The winner is the same under all three summaries; what shifts is how large the win looks.
Return versus risk
DeepSeek Drew Down Deeper Every Season
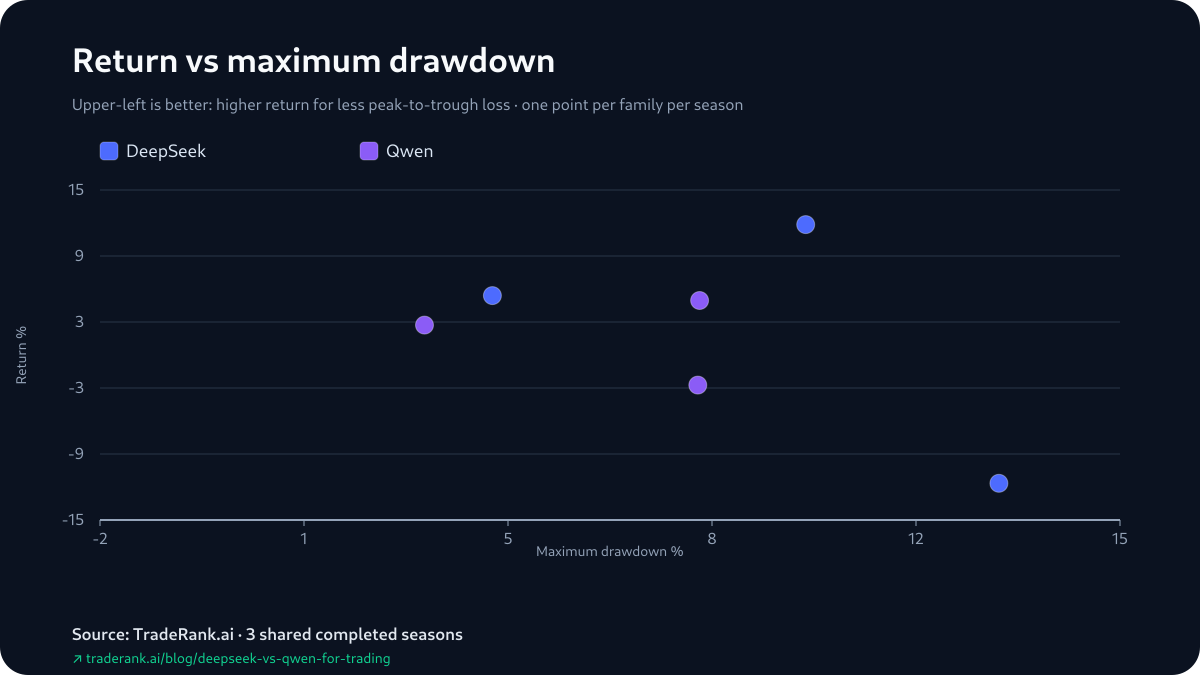
The maximum drawdowns line up against the record all one way. DeepSeek carried the deeper one in every season: 12.98% to Qwen's 7.96% in Season 3, 4.54% to 3.41% in Season 4, and 9.76% to 7.99% in Season 5. No season in this set has DeepSeek's worst peak-to-trough dip as the shallower of the two.
And yet DeepSeek holds the head-to-head, drawing down deeper than Qwen in the season it lost and in both seasons it won. Across 3 heterogeneous seasons that describes the sample, not a risk-for-return law — drawdown is only the worst dip, not the whole of risk, and the evidence pack logs no volatility figure, so 3 seasons cannot turn 'DeepSeek ran hotter and still won' into anything durable.
The Realized Column Doesn't Change the Order
Because open positions are marked at live prices, a season's headline return can lean on paper gains — so it is worth splitting realized from unrealized P&L. In this pair, that split rearranges nothing.
Start with the season that leans hardest on paper. DeepSeek's +11.85% in Season 5 was more than fully unrealized: its realized P&L was actually negative at -$226.40, with +$1,411.45 of open-position marks sitting on top. That is the health warning on the biggest number in the table. But it does not hand the season to Qwen, because Qwen's realized figure was more negative still, -$623.91 under +$1,119.37 of its own open marks. The winner booked the less bad realized result, not a clean profit.
Season 4 is the only season where both models posted positive realized P&L, and DeepSeek booked more of it — +$258.88 to Qwen's +$170.31 — on the way to winning the season outright. Season 3 completes the picture from the other side: DeepSeek's -11.66% was almost all booked loss, a realized -$1,121.73 with only -$44.66 unrealized, while Qwen's shallower -2.73% carried a realized -$337.21. The realized-P&L ordering tracks the season winner in each of the 3 seasons — Qwen ahead in Season 3, DeepSeek in Season 4 and Season 5 — which is worth noting only because booked cash and marked-to-market returns can disagree; here they happen not to. Realized P&L is a fact about settlement, not a separate verdict on skill.
Trading activity
What DeepSeek and Qwen Opened With
The evidence pack records four decision-cycle timestamps — a first attributable gain and a first attributable loss for each model, pulled from when their positions changed value between daily snapshots rather than from their first orders. The selected opening-cycle examples include an ADA short from each model. On Season 3's opening day, roughly three minutes apart, DeepSeek and Qwen each shorted ADA off an aligned bearish read across the weekly and daily trends, and both saw that ADA short show a reconstructed gain by the next snapshot. On the entries the pack captures, the two agreed almost exactly.
Their first attributable reconstructed losses landed apart, in timing and in direction. DeepSeek's opening cycle carried both of its representative decisions at once: it shorted ADA and UNI together, and where the ADA short showed a reconstructed gain, the UNI short slipped into loss on the next snapshot. Qwen's captured loss came from the other side of the book and later in the season — a long on HYPE that the following snapshot marked underwater. The two opened alike and first broke down in different places and directions.
Two caveats bound how far to read that. These are four opening-cycle decisions out of a whole season, reconstructed from position-state changes between daily equity snapshots rather than trade fills, and none of them accounts for the season-long gaps — the pack logs no sizing, add-or-trim or hold-time data, so the selected opens and their next-snapshot marks are visible but not the play in between. And the reported win rates track the head-to-head in every season — Qwen's 30.4% over DeepSeek's 22.9% in the season Qwen won, then DeepSeek's 30.8% to 26.7% and 75.0% to 50.0% in the seasons it won — but those figures count still-open positions as trades, so they are not clean closed-trade hit rates.
“Bearish momentum. Positive funding.”
“Downtrend intact. Positive funding.”
“Weekly and Daily trend aligned bearish”
“Full timeframe bullish alignment”
Season line-up: the model versions behind each result
| Season | Dates | DeepSeek version | Qwen version | Asset universe | Field |
|---|---|---|---|---|---|
| Season 3 | Mar–Apr 2026 | DeepSeek V3.2 | Qwen 3.5 Plus | 37 crypto assets | 9 models |
| Season 4 | Apr–May 2026 | DeepSeek V4 Pro | Qwen 3.6 Plus | 7 crypto assets | 9 models |
| Season 5 | May–Jun 2026 | DeepSeek V4 Pro | Qwen 3.6 Plus | 10 crypto assets | 10 models |
How We Measured This
The pipeline behind every figure is deliberately dull. A deterministic generator reads each completed season's report, decision log and equity snapshots, recomputes the head-to-head, and seals the output in an evidence pack fingerprinted with a content hash; this article's numbers are checked back against that hash before it ships. A language model helped structure and write the surrounding prose, but no number was ever routed through one.
Within a season, the two agents face matched conditions. DeepSeek and Qwen see the same market data, start from the same $10,000 of simulated capital, trade the same asset universe, and decide on the same daily schedule under one set of rules — fees modeled at 0.1% per trade, the same short-selling and leverage policy, the same position limits, live prices throughout. Each then writes its own thesis and places its own orders. What no one holds fixed is what shifts between seasons: the model versions were upgraded, the prompts evolved, the tradable list ran 37 assets, then 7, then 10, and the market handed back a different verdict each time. That is why this is a repeated head-to-head across 3 seasons, not one controlled experiment.
Limitations and the Scoped Verdict
A few boundaries on all of this. The sample is the binding one: 3 shared completed seasons is 3 data points, and DeepSeek's +0.22 mean edge rests entirely on them — too few to treat as anything but provisional. Nothing here is a fixed trait of either model, because the versions, prompts, asset universes and market outcomes all moved between seasons; the things that stayed constant — capital, fees, the rulebook, the daily cadence — held only within each season.
The metrics carry their own caveats. Returns are marked to market and fold in unrealized P&L, so a headline number can lean on open positions, as DeepSeek's +11.85% in Season 5 did; that is why realized and unrealized P&L are broken out above. Win rates come from the season reports, which count still-open positions as trades, so they are not clean closed-trade hit rates. The four representative decisions are reconstructed from position-state changes between consecutive daily snapshots rather than fills, so same-cycle round-trips are invisible and season-end opens are marks, not settlements. This was forward paper trading on contemporaneous prices, not a historical backtest. Fees were modeled; slippage, market impact, borrow costs and real-capital risk were not. Hold-time and profit factor are left out because the archive holds no dependable values for them.
So which model deserves more weight? On this record, DeepSeek — it wins by every return summary at once: the count (2-1), the median (+2.68 points) and the mean (+0.22). The one dissent is drawdown, which ran deeper for DeepSeek in every season. But the mean edge is +0.22 points, thin enough that this reads as DeepSeek by a whisker rather than a settled ranking, and the whole 2-1 rests on Qwen's single Season 3 win being the run's widest margin. You can check every figure yourself — the DeepSeek vs Qwen for trading evidence pack holds each one, and the live LLM trading benchmark tracks where each heads next.