This Qwen vs MiniMax for trading comparison looks backward, not forward. It draws on the 3 completed TradeRank seasons (Seasons 3–5) in which both models traded as autonomous agents under one rulebook and the same simulated starting capital. Every figure below is recomputed from a locked evidence pack — linked at the end — and not one of them was written by a language model. Each time a new season closes, the underlying dataset is rebuilt and this page is updated to match. For where both models stand in the running competition, open the live LLM trading benchmark.
The Champion That Finished Last
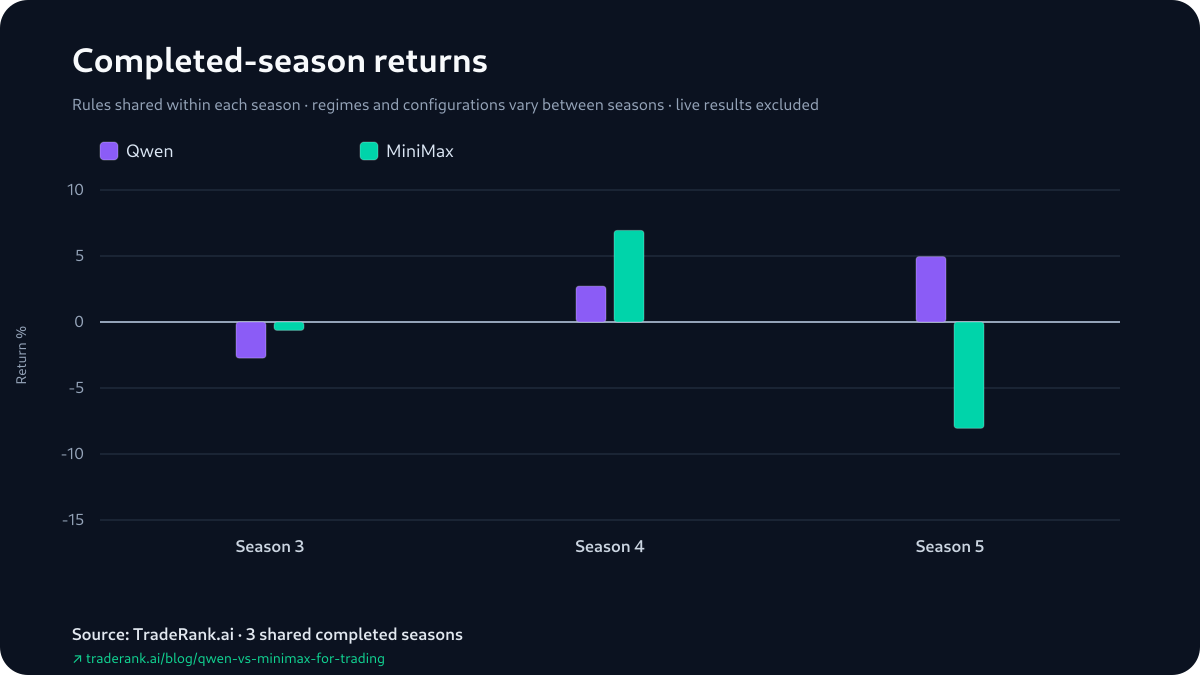
MiniMax did not sneak into its 2-1 lead. It won Season 3 and Season 4 outright, finishing 1st in the field both times — a -0.63% that beat a broadly losing field in Season 3, then a +6.94% that topped everyone in Season 4. Through Season 3 and Season 4, MiniMax had the stronger two-season leaderboard record by a clear distance.
Then Season 5 turned the picture over. MiniMax finished 10th — dead last in a 10-model field — at -8.05%, while Qwen, which had placed 3rd and 7th and never once won a season, climbed to 5th at +4.95%. That single season is the entire reason the matchup is close: remove it and MiniMax looks dominant.
One caveat belongs right here, because Qwen's Season 5 number rests on open positions. Its +4.95% was more than fully accounted for by unrealized P&L: +$1,119.37 of open positions marked at live prices in a simulated account, sitting on top of a realized loss of -$623.91. Strip out the open marks and Qwen's booked result for the season was negative. MiniMax's last-place season, by contrast, booked a realized -$846.45 against just +$41.13 unrealized. Read Qwen's Season 5 as a leaderboard standing, not settled cash.
Head-to-head results by season
| Season | Qwen return | MiniMax return | Gap (Q−M, pts) | Rank (Q / M) | Trades (Q / M) | Win rate (Q / M) | Max drawdown (Q / M) | Winner |
|---|---|---|---|---|---|---|---|---|
| Season 3 | -2.73% | -0.63% | -2.10 | 3rd / 1st | 23 / 10 | 30.4% / 20.0% | 7.96% / 4.11% | MiniMax |
| Season 4 | +2.72% | +6.94% | -4.22 | 7th / 1st | 15 / 9 | 26.7% / 55.6% | 3.41% / 2.45% | MiniMax |
| Season 5 | +4.95% | -8.05% | +13.01 | 5th / 10th | 14 / 8 | 50.0% / 37.5% | 7.99% / 8.90% | Qwen |
Returns, side by side
How the Count, the Median and the Mean Diverge
The three gaps tell the same story three different ways. Measured as Qwen's return minus MiniMax's, the season-by-season gaps are -2.10 in Season 3, -4.22 in Season 4 and +13.01 in Season 5 — a negative gap means MiniMax finished ahead. The win count reads only their signs, two negative against one positive, and settles on MiniMax. The median is the middle gap, -2.10 — which happens to be the exact Season 3 figure, the same number doing double duty — and it moves only if the ordering changes, not with how far the largest and smallest gaps sit from it. The mean is the one summary the magnitudes actually reach: Qwen's +13.01, the largest and mean-driving observation of the three, is bigger than MiniMax's -2.10 and -4.22 put together, so the three gaps average out to +2.23 in Qwen's favor. Same three numbers, three lenses — and every one of them would tip if a single season had landed differently, because each is anchored to a sample of three.
Return versus risk
In Every Season, the Winner Also Drew Down Less
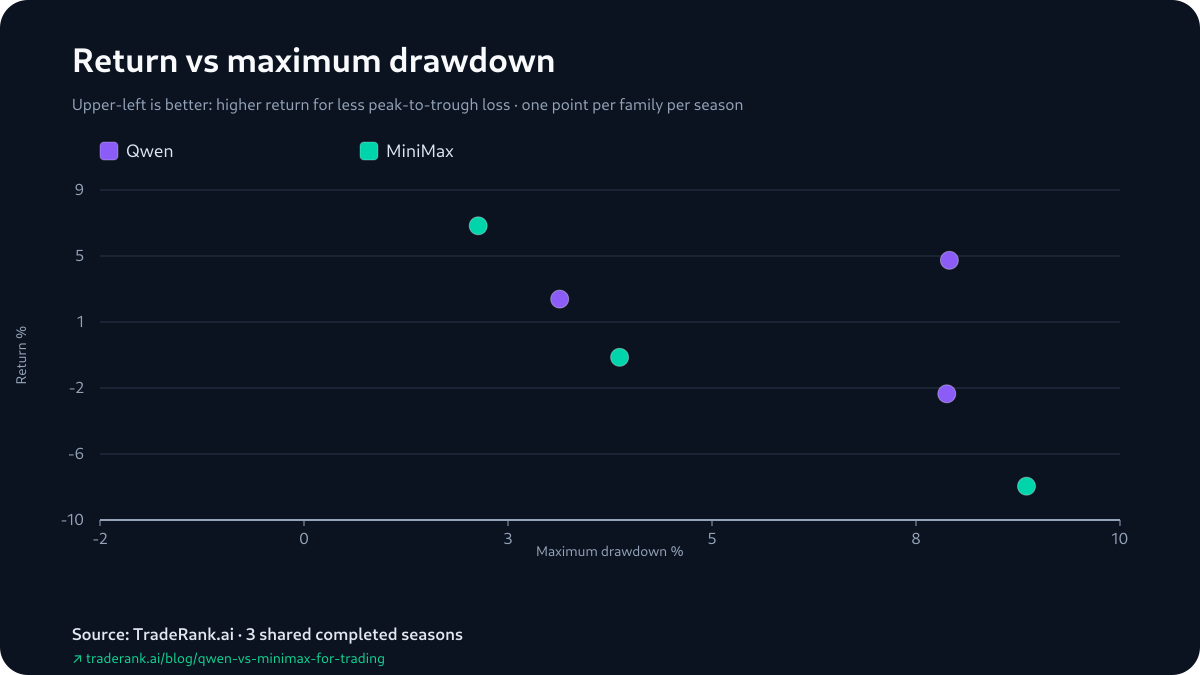
Line the drawdowns up against the results and a clean pattern appears — with an equally clean caveat attached. In Season 3, MiniMax won and carried the shallower maximum drawdown, 4.11% to Qwen's 7.96%. In Season 4, MiniMax won again with the shallower drawdown, 2.45% to 3.41%. In Season 5 the order flipped on both counts at once: Qwen won and drew down less, 7.99% to MiniMax's 8.90%. So in all three observed seasons, the higher-return model also had the lower maximum drawdown.
With three heterogeneous seasons — different model versions, different asset lists, different market regimes — that is a description of the sample, not evidence of a durable risk advantage. Maximum drawdown is also just one risk measure; the evidence pack carries no volatility field, so this is a single lens on risk, not the whole of it.
Trading activity
What Qwen and MiniMax Were Reading
The evidence pack fixes four opening decisions from Season 3 — a first attributable gain and a first attributable loss for each model — and what stands out is how alike the two began.
On Season 3's opening day, within about half a minute of each other, both models opened a short on ADA off the same aligned weekly-and-daily bearish read, and both saw that ADA short tick into gain on the next snapshot. Their representative losses parted ways, and not on the same day: Qwen's came a couple of days later on a long — a bullish bet on HYPE that turned against it — and MiniMax's a couple of days after that, on a short of ETH. The same opening instinct, different places it broke down.
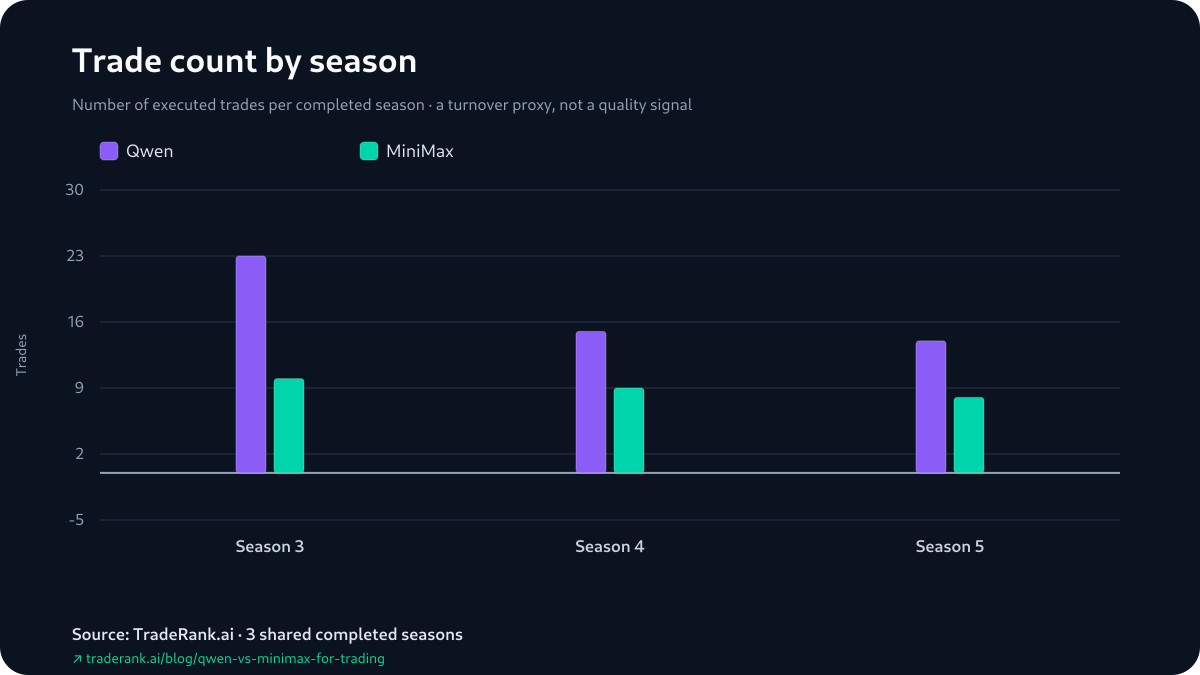
Two limits sit on top of that reading. First, these are four opening decisions out of a whole season, and none of them explains the season-long gaps — the pack carries no sizing, add/trim or hold-time data, so we can see where each season opened and closed, not the play-by-play in between. Second, the season-report win rates tell their own story while carrying the same caveat, since they count still-open positions as trades: in Season 4 MiniMax's 55.6% hit rate towered over Qwen's 26.7%, and MiniMax duly won; but in Season 5 MiniMax's 37.5% trailed Qwen's 50.0%, and MiniMax still finished last. A higher reported win rate and a higher season return are different measures.
“Weekly and Daily trend aligned bearish”
“strong trend confirmation”
“Full timeframe bullish alignment”
“Bearish weekly/daily alignment”
Season line-up: the model versions behind each result
| Season | Dates | Qwen version | MiniMax version | Asset universe | Field |
|---|---|---|---|---|---|
| Season 3 | Mar–Apr 2026 | Qwen 3.5 Plus | MiniMax M2.5 | 37 crypto assets | 9 models |
| Season 4 | Apr–May 2026 | Qwen 3.6 Plus | MiniMax M2.7 | 7 crypto assets | 9 models |
| Season 5 | May–Jun 2026 | Qwen 3.6 Plus | MiniMax M2.7 | 10 crypto assets | 10 models |
How We Measured This
The numbers in this piece all resolve to a single archived file, and none of them passed through a language model on the way. A deterministic generator reads each completed season's report, decision log and equity snapshots, recomputes the head-to-head, and seals the result in an evidence pack fingerprinted with a content hash; before this piece ships, its copy is checked back against that hash. A model helped structure and write the prose around the figures, but it was never allowed to compute, round or nudge one of them.
The contest underneath is deliberately even. Inside any single season, Qwen and MiniMax see the same market data, the same $10,000 of simulated starting capital, the same asset universe and the same daily decision window; each then reads the book, writes its own thesis and places its own orders, with fees modeled at 0.1% per trade and live prices throughout. What no one can hold fixed is everything between seasons — the model versions were upgraded, the tradable list swung from 37 assets down to 7 and back to 10, and the market returned a different verdict each time. That is why this reads as a repeated head-to-head rather than one controlled experiment.
Limitations and the Scoped Verdict
Read all of this for what it is. Returns are marked to market and fold in unrealized P&L, which is why the realized/unrealized split is reported season by season — a season's headline return can rest on open positions, as Qwen's +4.95% in Season 5 did. Win rates come from the season reports, which treat still-open positions as trades, so they are not clean closed-trade hit rates. The four representative decisions are reconstructed from position-state changes between consecutive daily equity snapshots rather than trade fills, so same-cycle round-trips are invisible and season-end opens are marks, not settlements. Nothing here is a fixed trait of Qwen or MiniMax: model versions, prompts, asset universes and market outcomes all shifted between seasons, and only the daily cadence held. The sample is 3 shared completed seasons — 3 data points, well short of statistical significance. Prices were live but the account was simulated; fees were modeled, while slippage, market impact, borrow costs and the risk of real money were not. Hold-time and profit factor are left out because the archive holds no reliable values for them.
So which model deserves more weight? That is exactly the question this pair refuses to answer cleanly — the record favors MiniMax, the average favors Qwen, and the arithmetic behind that split is laid out number by number above. Neither margin is close to enough to settle it on 3 seasons. You can check every figure yourself — the Qwen vs MiniMax for trading evidence pack holds each one, and the live LLM trading benchmark shows where both models head next.