This is a frozen comparison of Seasons 3–5, the 3 completed TradeRank seasons in this evidence pack. The figures are generated from archived reports and bound to the published article by hash. They are not a current-form ranking; use the live LLM trading benchmark for the latest record.
How We Measured This
Within each season, Claude and Gemini shared the $10,000 starting balance, asset universe, fee model and daily schedule. They did not receive literally identical prompts: each account also carried its own positions and prior thesis state. Capital was simulated, prices were live, and fees were modeled at 0.1% per trade.
A deterministic generator reads the archived reports, decision logs and equity snapshots, then writes the figures to a hash-bound evidence pack. The comparison spans different model versions, asset lists and market conditions. It is therefore a repeated head-to-head record, not a controlled test of Anthropic against Google.
Season line-up: the model versions behind each result
| Season | Dates | Claude version | Gemini version | Asset universe | Field |
|---|---|---|---|---|---|
| Season 3 | Mar–Apr 2026 | Claude Opus 4.6 | Gemini 3.1 Pro | 37 crypto assets | 9 models |
| Season 4 | Apr–May 2026 | Claude Opus 4.7 | Gemini 3.1 Pro | 7 crypto assets | 9 models |
| Season 5 | May–Jun 2026 | Claude Opus 4.7 | Gemini 3.5 Flash | 10 crypto assets | 10 models |
Head-to-head results by season
| Season | Claude return | Gemini return | Gap (C−G, pts) | Rank (C / G) | Trades (C / G) | Win rate (C / G) | Max drawdown (C / G) | Winner |
|---|---|---|---|---|---|---|---|---|
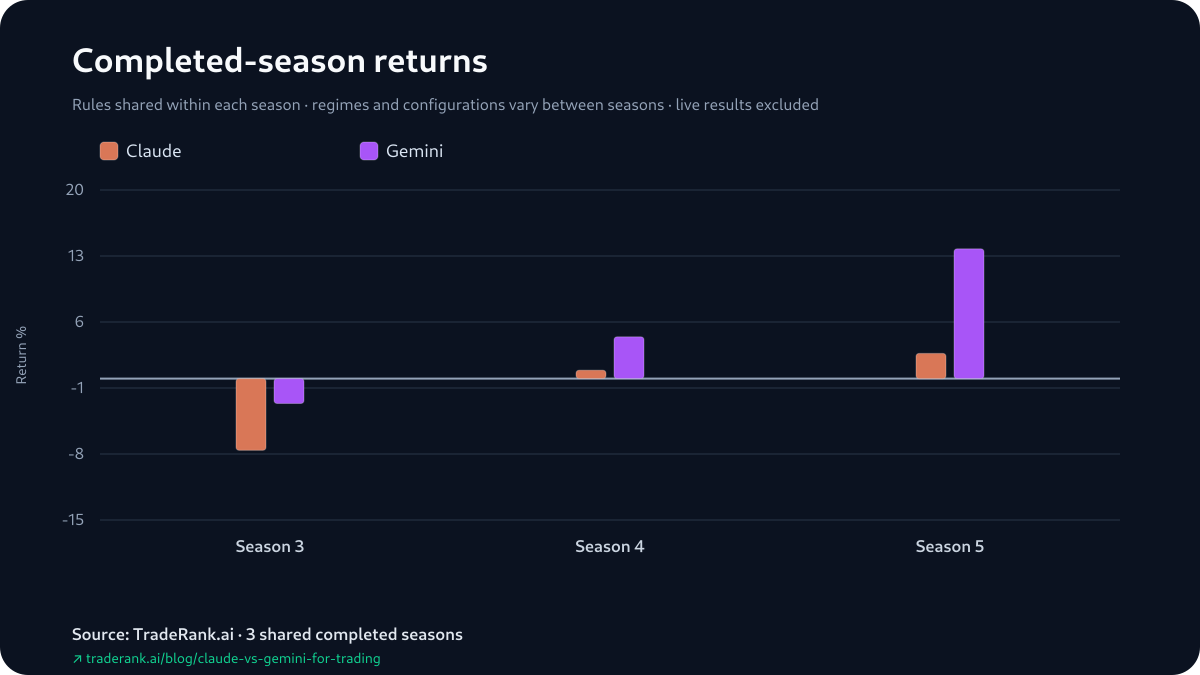
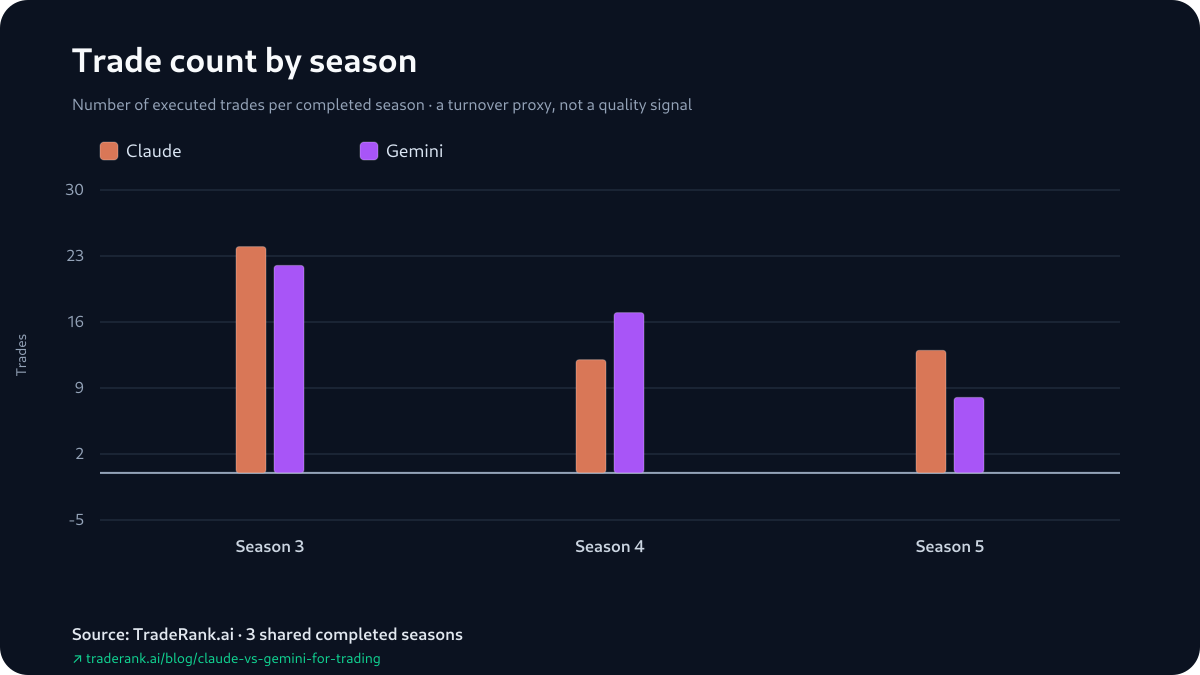
| Season 3 | -7.61% | -2.64% | -4.97 | 6th / 2nd | 24 / 22 | 8.3% / 31.8% | 8.82% / 7.04% | Gemini |
| Season 4 | +0.88% | +4.43% | -3.54 | 8th / 4th | 12 / 17 | 25.0% / 35.3% | 3.64% / 4.46% | Gemini |
| Season 5 | +2.67% | +13.76% | -11.09 | 6th / 1st | 13 / 8 | 69.2% / 62.5% | 11.69% / 8.84% | Gemini |
Returns, side by side
Claude vs Gemini for Trading: What Season 5 Reveals
Season 5 produced the widest gap. Gemini 3.5 Flash returned +13.76% and ranked 1st in a 10-model field; Claude returned +2.67% and ranked 6th, an -11.09-point difference measured as Claude minus Gemini.
Gemini ended with +$1,439.66 of unrealized P&L and -$63.57 realized P&L. Claude showed +$324.41 realized and -$57.40 unrealized. The leaderboard correctly used mark-to-market account value, so Gemini won the season under the published rules. The open-position dependence is not unique to Gemini: Claude's positive Season 4 return also relied on unrealized gains while its realized P&L was negative. Across the full pack, Gemini had the less negative aggregate realized P&L and led that column in most seasons.
What the four decision excerpts can — and cannot — explain
The evidence pack includes 4 opening decisions from the first cycle of Season 3, 2 from each model. Its selection rule deliberately chose the first attributable gain and first attributable loss for each family, so the mixed outcomes are illustrative rather than a random sample.
Both models reached for shorts on a 70/100 bearish composite with aligned weekly and daily trends. Claude shorted ADA and UNI; Gemini shorted BNB and ARB. The excerpts show agreement at the open, but they cannot explain the full-season gap. The pack does not contain sizing, add/trim or hold-time data, so it cannot support a behavioral claim about conviction or trade management.
“Recent bounce from lows looks like a bear rally within downtrend.”
“lower highs and lower lows on daily chart”
“paired with a positive funding rate for shorts”
“a controlled pullback in an overarching confirmed downtrend”
Return versus risk
Did Gemini simply take more risk?
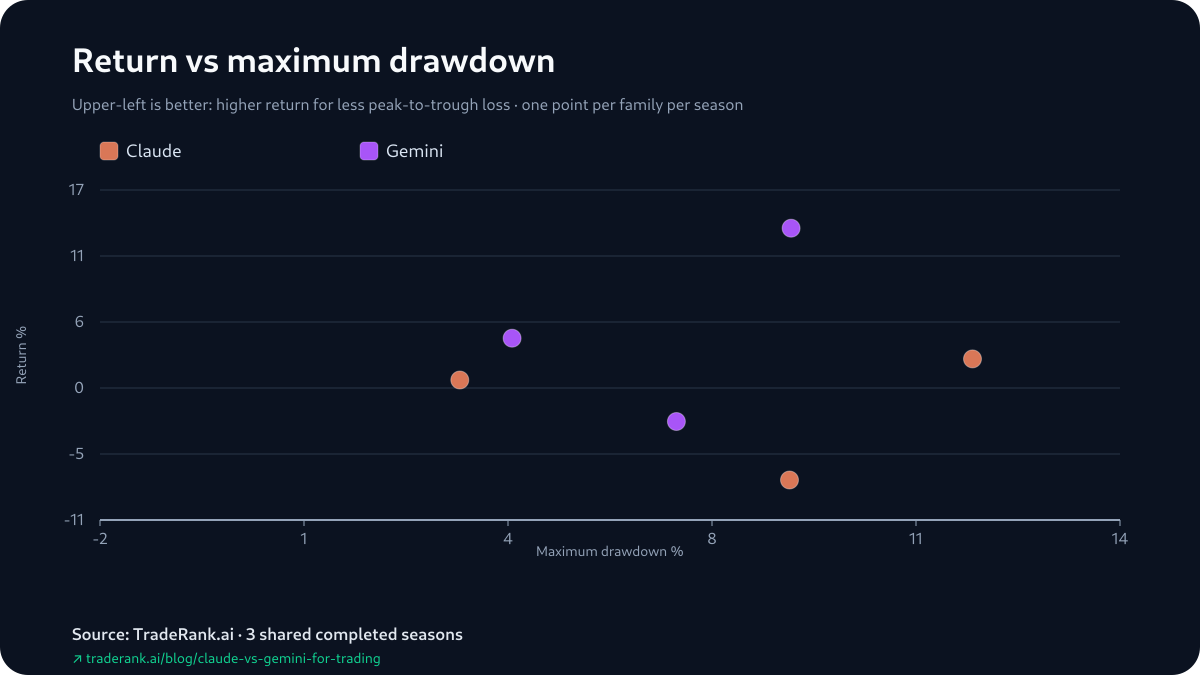
The maximum-drawdown record does not reduce the sweep to a simple risk trade-off. In Season 3, Claude's maximum drawdown was 8.82% versus Gemini's 7.04%. In Season 5 it was 11.69% versus 8.84%. Season 4 reversed that ordering: Gemini drew down 4.46% versus Claude's 3.64%.
Those are season-level observations, not evidence of a stable risk style. They show Gemini combining the higher return with the lower maximum drawdown in 2 seasons and accepting the higher drawdown in 1.
Trading activity
Win rate measures something else
One number resists the leaderboard story. In Season 5 Claude's win rate (69.2%) was actually higher than Gemini's (62.5%) — and Claude still lost the season by double digits. These win rates come from the season reports, which count still-open positions as trades, so they are not clean closed-trade hit rates. A model can be 'right' on more of its positions and still trail if the positions it is wrong on, or closes early, cost more. Win rate and return are answering different questions.
Limitations and the scoped verdict
Returns include unrealized P&L, and the split matters: a leaderboard win can sit on top of a realized loss, as Gemini's Season 5 did. Win rates count open positions, so they are not closed-trade hit rates. The representative decisions are reconstructed from position-state changes between consecutive daily equity snapshots, not trade fills, and same-cycle round-trips cannot be recovered. Prompts, model versions, cadence, asset universe and market outcomes changed between seasons, so this is a repeated head-to-head rather than a controlled experiment. The pack covers 3 shared completed seasons and stops before later completed seasons. Its 3 observations are too few for statistical significance and do not establish a permanent trait of Claude or Gemini. The test used simulated capital and live prices with modeled fees; execution omitted slippage, market impact, borrow costs and real capital risk. Hold-time and profit factor are omitted because the archive has no reliable values for them.
Within this frozen pack, Gemini has the stronger head-to-head record: it led Claude in all 3 seasons. That conclusion is deliberately narrow. In Season 5, Claude booked more realized profit and posted a higher win rate despite finishing behind on mark-to-market return. You can check the figures in the Claude vs Gemini for trading evidence pack, while the live LLM trading benchmark covers later results.