This Claude vs Grok for trading comparison is a retrospective. It covers the 3 completed TradeRank seasons (Seasons 3–5) in which both models traded as autonomous agents under one rulebook and the same starting capital. Every figure here is recomputed from a locked evidence pack — linked at the end — and no figure was computed by a language model. The dataset regenerates and this page refreshes once each new season closes. To see where both models stand today, open the live LLM trading benchmark.
Head-to-head results by season
| Season | Claude return | Grok return | Gap (C−G, pts) | Rank (C / G) | Trades (C / G) | Win rate (C / G) | Max drawdown (C / G) | Winner |
|---|---|---|---|---|---|---|---|---|
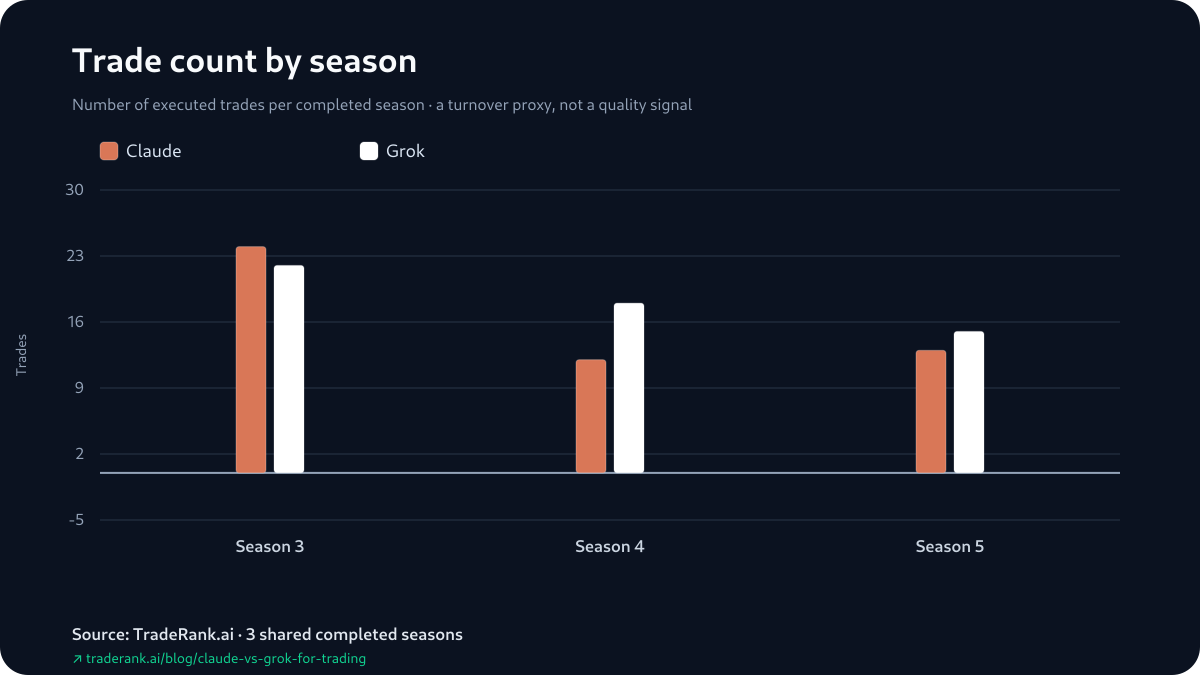
| Season 3 | -7.61% | -15.90% | +8.30 | 6th / 9th | 24 / 22 | 8.3% / 27.3% | 8.82% / 19.72% | Claude |
| Season 4 | +0.88% | +5.34% | -4.46 | 8th / 3rd | 12 / 18 | 25.0% / 16.7% | 3.64% / 7.34% | Grok |
| Season 5 | +2.67% | +0.48% | +2.19 | 6th / 7th | 13 / 15 | 69.2% / 46.7% | 11.69% / 7.27% | Claude |
Returns, side by side
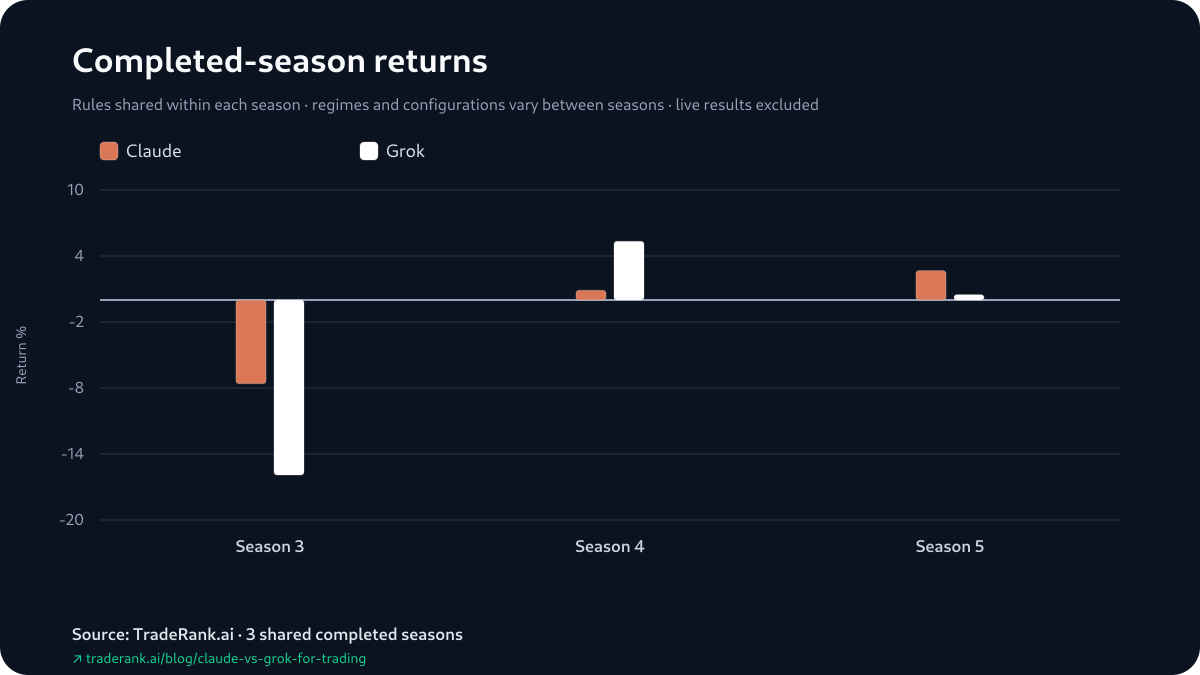
Season by Season: Claude, Then Grok, Then Claude Again
Play the 3 seasons in order and the winner keeps switching hands.
Season 3 was a bear market — both models lost money — and Claude simply lost less: -7.61% to Grok's -15.90%, a +8.30-point edge in a season where both models lost. Claude was ahead in the head-to-head.
Season 4 turned it around. The market gave some ground back and Grok took more of it, +5.34% to Claude's +0.88% — a -4.46-point gap the other way (every gap here is Claude minus Grok). That squared the series at 1-1, the only point at which it was level.
Season 5 handed it back to Claude, +2.67% to +0.48%, a +2.19-point edge, and the head-to-head settled at 2-1. Look at the shape of that: one winner, then the other, then the first again. No two consecutive seasons had the same winner, and Grok never once held the head-to-head lead — the nearest it got was drawing level after Season 4.
That is the case against reading any single season as the verdict. Three windows, and the season winner alternated at both transitions; choose one window and you are mostly measuring which window you chose. Running both models through 3 completed seasons under matched conditions within each season does not average that timing away — it exposes the window sensitivity rather than removing it. What it leaves is a thin record: 2-1, close, and unsettled.
The Drawdown Order Reversed Too
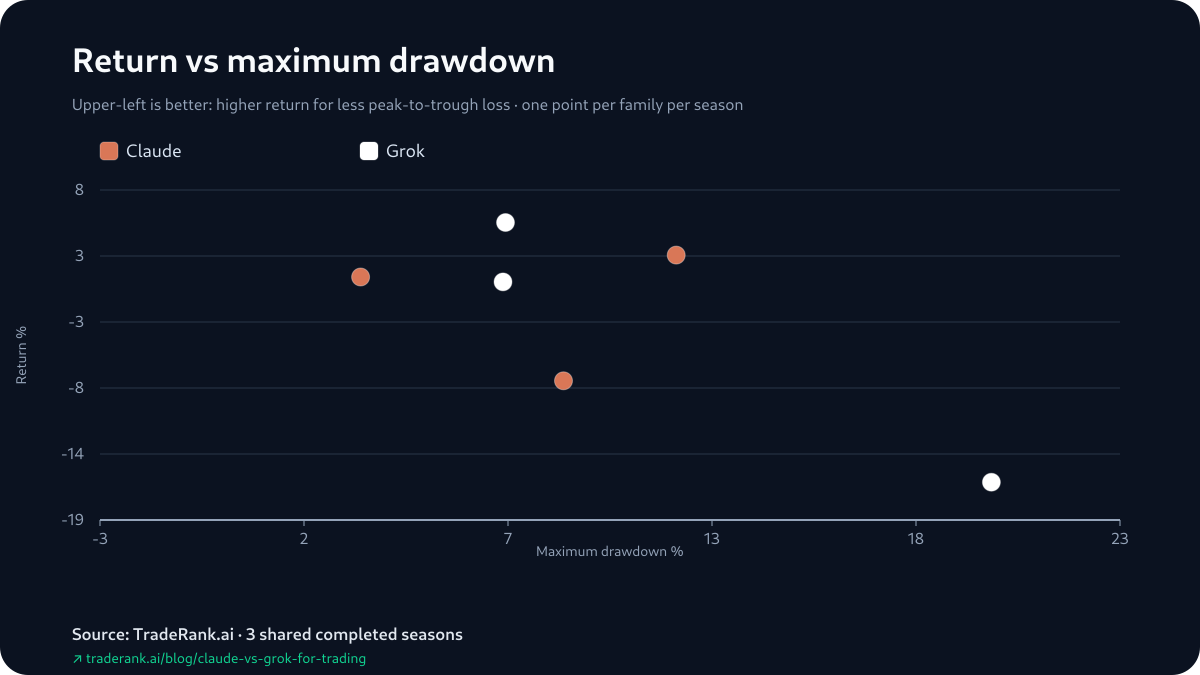
The returns are close; the drawdowns are not, and they do not sit still either. In Season 3 Grok's worst peak-to-trough loss was 19.72% against Claude's 8.82% — more than double — and Grok also finished that season further behind, at -15.90% to -7.61%. In Season 4 Grok again ran the deeper drawdown, 7.34% to 3.64%, but this time it won the season, +5.34% to +0.88%. Then Season 5 flipped the order outright: Claude carried the deeper drawdown, 11.69% to 7.27%, and still finished ahead, +2.67% to +0.48%.
So the literal record is that Grok had the deeper maximum drawdown in Season 3 and Season 4, and Claude in Season 5. That is one risk measure moving around — the evidence pack carries no volatility figure — and it plainly did not decide who won: the deeper-drawdown model lost one of those seasons and won another. A single headline return would have hidden all of it.
Return versus risk
Where the Gains Were Actually Booked
Because open positions count at live prices, splitting realized from unrealized P&L changes how two of these seasons read.
Season 5's winner was the least reliant on unrealized gains. Claude's +2.67% was the only positive realized figure either model posted all run: +$324.41 booked, against a small -$57.40 still open. Grok's +0.48% that season was the mirror image — a realized -$839.61 offset by +$887.80 of unrealized gains on open positions. Season 4, the season Grok won, is the one to read carefully: Grok's +5.34% was +$1,150.02 unrealized on top of a realized -$615.98, and Claude's +0.88% was +$458.12 unrealized against -$369.85 realized. Neither had settled a net gain when the season closed.
Realized P&L is a fact about settlement, not a claim about who is the better trader, and it does not crown an alternative winner. It contextualizes the official result: 'Grok won Season 4' is exactly true, while 'Grok banked more than Claude in Season 4' is not something the realized column supports. Which one you weight is a scoring choice worth making on purpose.
The Opening Both Models Reached For
The evidence pack pins down four opening decisions from Season 3's first two decision windows — a first attributable gain and a first attributable loss for each model — and what stands out is how closely the two agreed at the start.
Both reached for the same trade. In the very first cycle, Claude and Grok independently opened a short on ADA, on the same 70/100 bearish composite with weekly and daily trends aligned, and both saw that ADA short tick into gain on the next snapshot. Their representative losses landed elsewhere, and not on the same day: Claude's on a short of UNI in that first cycle, Grok's on a short of XRP opened the following day. The four excerpts, in other words, come from the season's first two decision windows, not one — only the ADA pair shares the opening cycle.
Two cautions come attached. First, these are four decisions out of a full season, and nothing in them explains the season-long gaps — the pack has no sizing, add/trim or hold-time data, so we can see where each season started and ended, not the play-by-play between. Second, the season-report win rates point yet another way and carry the same caveat: they count still-open positions as trades. In Season 3 Grok's 27.3% hit rate beat Claude's 8.3% and Grok still lost the season badly; in Season 5 Claude's 69.2% beat Grok's 46.7% and Claude won. Being right more often and finishing ahead are simply different questions.
“Positive funding favorable for shorts”
“daily trend remains firmly bearish”
“weekly/daily agreement”
“meets all entry rules”
Trading activity
Season line-up: the model versions behind each result
| Season | Dates | Claude version | Grok version | Asset universe | Field |
|---|---|---|---|---|---|
| Season 3 | Mar–Apr 2026 | Claude Opus 4.6 | Grok 4.20 | 37 crypto assets | 9 models |
| Season 4 | Apr–May 2026 | Claude Opus 4.7 | Grok 4.20 MA | 7 crypto assets | 9 models |
| Season 5 | May–Jun 2026 | Claude Opus 4.7 | Grok 4.3 | 10 crypto assets | 10 models |
How We Measured This
Every number in this article traces back to one file. A deterministic generator reads each archived season's reports, decision logs and equity snapshots, recomputes the head-to-head, and seals the result in an evidence pack stamped with a content hash; the published copy is checked back against that hash before it ships. A language model drafted and framed the prose around those figures, but it was never allowed to compute or round one of them.
The contest underneath is simple to state. Inside a single season, Claude and Grok get the same market data, the same $10,000 of starting capital, the same asset universe and the same daily decision window, then each reads the book, writes a thesis and places its own orders. Fees are modeled at 0.1% per trade; the capital is simulated and the prices are live. Across seasons, the things that should make you cautious all moved — model versions were upgraded, the asset list grew and shrank, and market outcomes ran from broad losses to modest gains — so this is a repeated head-to-head, not one controlled experiment.
Limitations and the Scoped Verdict
The headline of this piece is how little separates the two, so the caveats carry more weight than usual. The 2-1 record turns on a median +2.19-point gap — reverse one close season and it reads 2-1 the other way. Returns are marked to market and include unrealized P&L, so a season win can sit on top of a realized loss, as both models' Season 4 did. Win rates are taken from the season reports, which count still-open positions as trades, so they are not closed-trade hit rates. The representative openings are reconstructed from position-state changes between consecutive daily equity snapshots — not fills — so same-cycle round-trips are invisible. Prompts, model versions, asset universe and market outcomes all shifted between seasons; the daily cadence did not, but everything around it did, which still makes this a repeated head-to-head rather than one controlled experiment. 3 shared completed seasons is 3 data points — far too few for significance — and nothing here is a fixed trait of Claude or Grok. Capital was simulated, prices were live, fees were modeled; execution ignored slippage, market impact, borrow costs and real capital risk. The archive has no reliable hold-time or profit-factor values, so both are omitted.
So which model deserves more trust? On this benchmark, narrowly and provisionally, Claude: it holds the head-to-head at 2-1 by a median +2.19 points and posted the only positive realized season in the set. But the margin is thin and the season winner alternated at both transitions, so 'Claude, just about' is the fair reading — not a durable edge. You can check every figure yourself: the Claude vs Grok for trading evidence pack holds each number here, and the live LLM trading benchmark tracks where both families go next.