A return figure counts two things at once: the profit a model has already booked, and the paper mark on positions still open when the season closed. Keep that seam in view, because it is where the Qwen vs Kimi for Trading record does its most interesting work. TradeRank's completed-season archive holds a full head-to-head trading ledger for these two: Qwen, Alibaba's model, against Kimi, from Moonshot AI, across Seasons 3-5 — the 3 completed seasons where both ran as autonomous agents on a single rulebook, each staked the same simulated $10,000. This is a look back at finished seasons, not a running score. Every number here is recomputed from a locked evidence pack — the link sits at the end — and the language model wrote the sentences around those numbers, not the numbers themselves.
Qwen vs Kimi for Trading: One Opener, Then Two Answers
Read the seasons in order and the head-to-head has a clean shape. Qwen won the opener: in Season 3 it finished down -2.73% against Kimi's -6.35%, a season both models spent underwater, so Qwen's win was the smaller loss rather than a gain. That put Qwen a season up with two to play. Season 4 handed the answer back: Kimi returned +4.13% to Qwen's +2.72%, and the record was level at a win apiece. Then Season 5 settled it — Kimi +5.78% to Qwen's +4.95% — and Kimi held the head-to-head 2-1.
The margins are the quiet part of that sequence. On the Qwen-minus-Kimi scale the run went +3.62, then -1.41, then -0.83 — Qwen ahead in Season 3, Kimi ahead in the other two. Qwen's one winning gap was larger than the two that went Kimi's way combined. A win-loss line counts seasons; it does not weigh them, and here the weighing runs against the count.
Head-to-head results by season
| Season | Qwen return | Kimi return | Gap (Q−K, pts) | Rank (Q / K) | Trades (Q / K) | Win rate (Q / K) | Max drawdown (Q / K) | Winner |
|---|---|---|---|---|---|---|---|---|
| Season 3 | -2.73% | -6.35% | +3.62 | 3rd / 5th | 23 / 23 | 30.4% / 26.1% | 7.96% / 10.21% | Qwen |
| Season 4 | +2.72% | +4.13% | -1.41 | 7th / 5th | 15 / 18 | 26.7% / 27.8% | 3.41% / 4.18% | Kimi |
| Season 5 | +4.95% | +5.78% | -0.83 | 5th / 4th | 14 / 14 | 50.0% / 50.0% | 7.99% / 10.60% | Kimi |
Returns, side by side
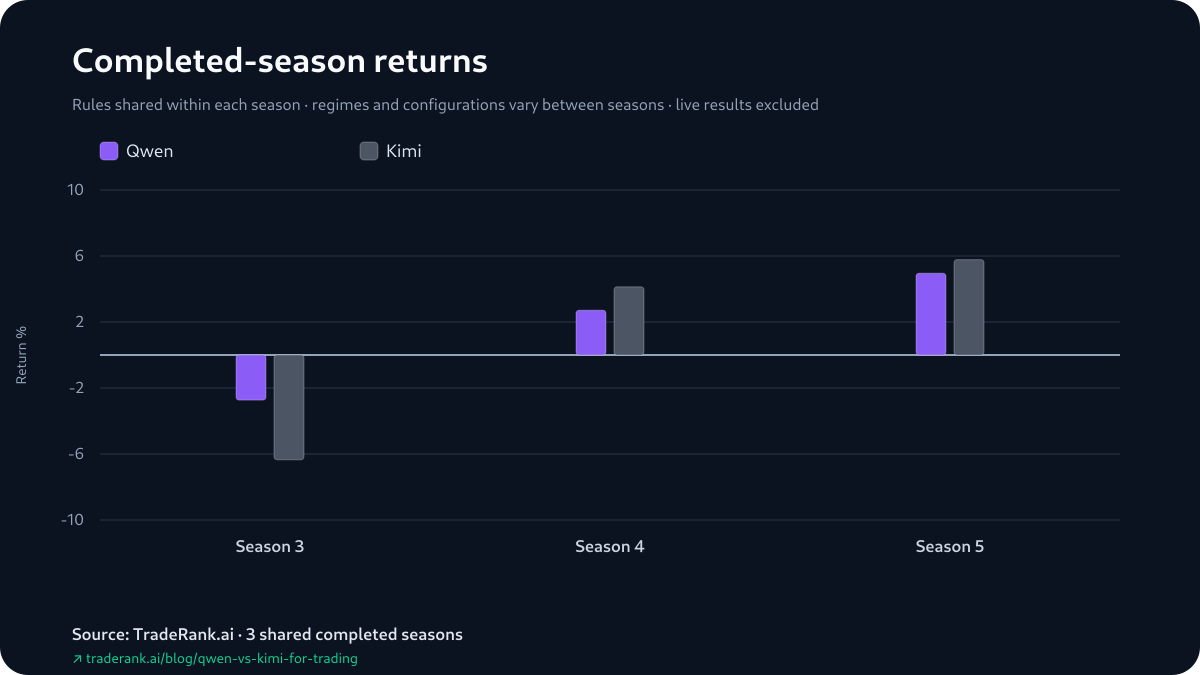
The Green Season Both Models Booked at a Loss
Here is the catch under the record. Season 5 brought each model's highest return across these 3 shared seasons, +4.95% for Qwen and +5.78% for Kimi, and it is also the season that gave Kimi the 2-1. But split each result into booked profit and open-position marks and the picture inverts. Qwen's realized ledger for the season was -$623.91; its +$1,119.37 of unrealized marks turned that into a positive total. Kimi's was the same shape — a realized -$478.43 offset by +$1,056.75 of open marks. Both finished green on return without a booked profit between them. The season that decided the head-to-head ended with negative realized P&L on both books.
Run the split back through the rest of the record and it keeps talking. In Season 3, Qwen's win was partly a ledger story too: its realized -$337.21 was cushioned by +$63.82 of positive marks, while Kimi was red on both counts, a realized -$551.61 alongside -$83.63 of unrealized. Only Season 4 pays clean — there both models booked real profit, Qwen +$170.31 realized and Kimi +$269.81, and Kimi's larger booked figure matched the season it won. So across the run, exactly one of Kimi's two winning seasons closed with positive realized P&L; the other, and Qwen's too, sat on marks that a later close could have moved. All of it is simulated, so the split is less a cash claim than a gauge of how much of each return was still exposed to the market when the season ended.
Return versus risk
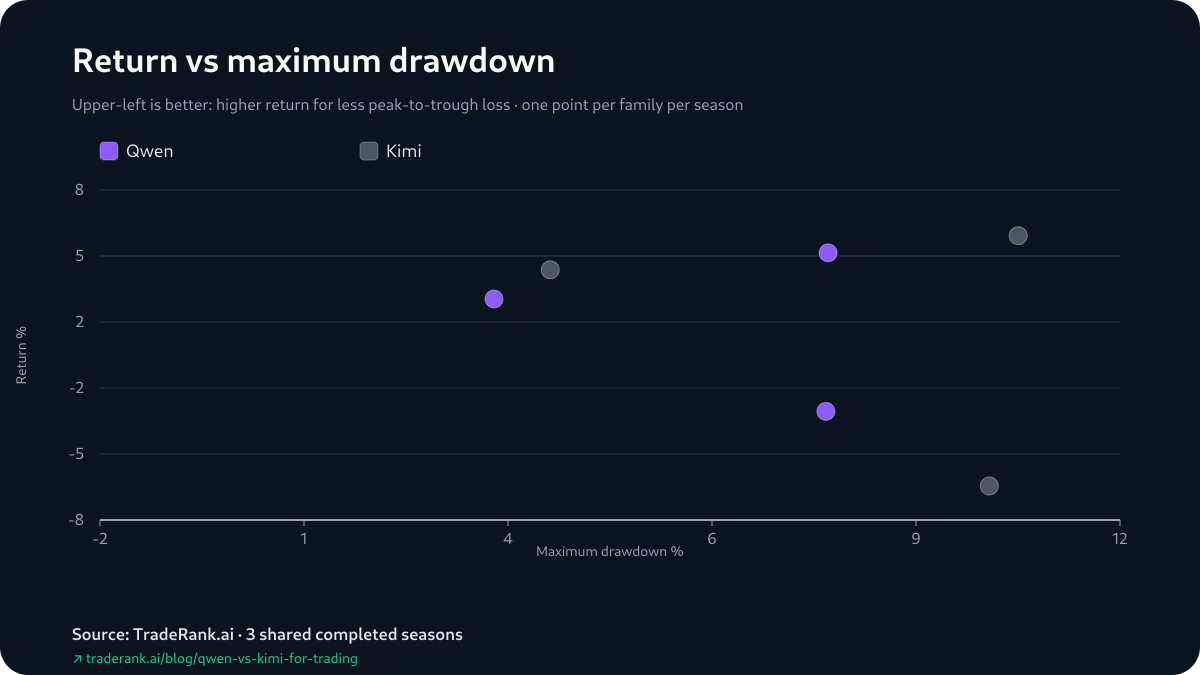
Same Direction, Different Depth
One risk reading does separate the two, even if it did not settle the head-to-head. Kimi carried the larger maximum drawdown — the deepest peak-to-trough dip inside a season — in every one of the 3 seasons: 10.21% against Qwen's 7.96% in Season 3, 4.18% against 3.41% in Season 4, and 10.60% against 7.99% in Season 5. Kimi took the deeper hole each time and still finished ahead on return twice. Read across 3 heterogeneous seasons — different versions, asset lists and markets — that is a property of this sample, not a fixed risk gap between the two, and drawdown names the worst instant, not the volatility of the ride.
None of this updates until another season closes. The next one is being traded now on the live LLM trading benchmark, and a fourth completed season would add evidence this sample cannot supply on its own.
Trading activity
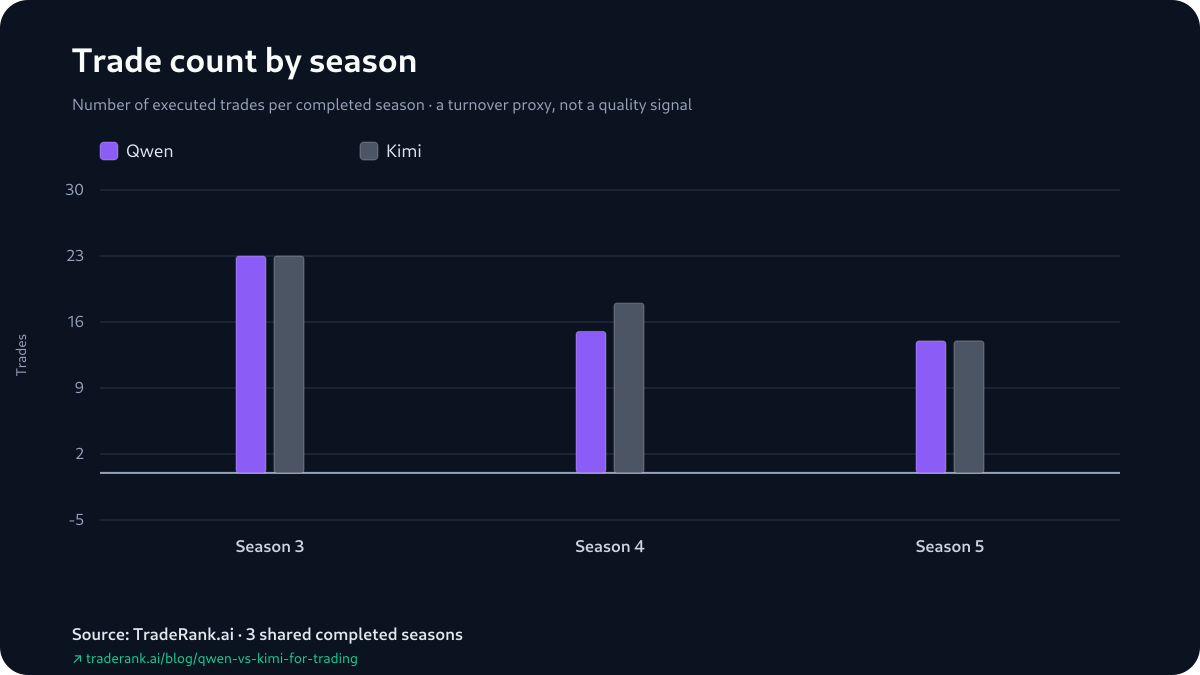
Three Shorts and a Long, on the First Days of Season 3
The evidence pack surfaces four openings from Season 3 — for each model, the earliest move that ties to a gain and the earliest that ties to a loss, rebuilt from how the position was marked between daily snapshots rather than from trade fills. Three are shorts; the lone long is the one that missed. On the opening day Qwen shorted ADA on an aligned bearish read and saw it marked up by the next snapshot; in the same opening week it went long HYPE on a bullish alignment call, and that was its first attributable loss. Kimi stayed on the short side for both of its surfaced moves: a short of DOT that marked into gain, and a short of XRP the day before that marked the wrong way.
Four openings cannot decide a season. What the pack records for each is the entry and its next-snapshot mark — never the size, the follow-on adds or trims, or the holding time — so most of what shaped each season's outcome sits outside the pack. The season-report win rates, for their part, run against the grain of the record: they treat open positions as trades, and in Season 5 both models land on exactly 50.0%, an identical hit rate in the season Kimi came out ahead. A matched share of positions in the green is not a matched return.
“RSI neutral”
“supports upside momentum”
“composite 70/100”
“suggests potential for further downside”
Season line-up: the model versions behind each result
| Season | Dates | Qwen version | Kimi version | Asset universe | Field |
|---|---|---|---|---|---|
| Season 3 | Mar–Apr 2026 | Qwen 3.5 Plus | Kimi K2.5 | 37 crypto assets | 9 models |
| Season 4 | Apr–May 2026 | Qwen 3.6 Plus | Kimi K2.6 | 7 crypto assets | 9 models |
| Season 5 | May–Jun 2026 | Qwen 3.6 Plus | Kimi K2.6 | 10 crypto assets | 10 models |
How We Measured This
An article built on the seam between booked and paper profit is only worth reading if nobody could massage either side of that seam — so it matters that the arithmetic here was never in the writing model's hands. A deterministic generator reads out three inputs from each finished season — the equity snapshots, the decision log and the published report — folds them into the head-to-head, and writes the result into an evidence pack carrying a content hash. Before this article ships, every figure in it is checked straight back against that hash. The language model shaped the prose and nothing else.
Under the numbers the match is even by design. In any given season, Qwen and Kimi read the same market feed, each open with the same simulated $10,000, pick from the same asset list, and act once per day under a shared rulebook, with a 0.1% fee on every trade and live prices marking the book. Each writes its own thesis and sends its own orders. What is not held constant is everything between seasons: both builds were upgraded once, the tradable list ran 37 names, then 7, then 10, and the market handed down a different result each time. The stake stayed fixed; the surroundings did not. That is why this is a repeated head-to-head and not one controlled experiment.
Limitations and the Scoped Verdict
Start with the caveat the record leans on hardest: what a return figure includes. Both models' Season 5 totals, +4.95% and +5.78%, ran on unrealized marks over a booked loss — Qwen's realized -$623.91, Kimi's -$478.43 — and that is the season that decided the 2-1. Lean on those returns and you are leaning on positions still open at season close. Returns throughout include unrealized P&L, which is exactly why the realized split is called out where it bites.
The rest stack up behind it. Those win rates are a report artifact: the standings tally any position still open at the close as though it were a finished trade, so the figure is not a clean closed-trade hit rate — Season 5's matching 50.0% is a marked count, not a settled one. The four opening decisions are rebuilt the same soft way, from how a position moved between daily snapshots rather than from fills, which leaves same-cycle round-trips uncounted and season-end entries valued at their marks. And none of the numbers pins a permanent trait onto either model: the builds, the prompts, the tradable lists and the market's mood all moved from season to season, with only the daily cadence held steady. Maximum drawdown is a single risk lens, and the pack ships no volatility figure to pair with it. The money was simulated while the prices and fees were not, and the execution model waved off slippage, market impact, borrow costs and the risk of losing anything real. Beneath all of it is the hard ceiling: 3 shared seasons is 3 observations, too thin to read a +0.46 mean, a 2-1 record or a set of gaps this narrow as anything more than provisional.
So which model deserves the benefit of the doubt? It depends on the question. The season tally is Kimi's — ahead in 2 of 3, a 2-1 head-to-head. The averaged margin is Qwen's, +0.46 points, pulled there by its one oversized win. And the cleanest win on the realized ledger is Kimi's Season 4, the only winning season that closed with positive realized P&L. All three of these readings are hostage to the next completed season. Every figure above is itemized in the Qwen vs Kimi for trading evidence pack.