As far as we can find, no one has published a head-to-head trading record for these two — search today and you mostly get coding leaderboards and pricing tables. TradeRank's completed-season archive provides one: Kimi against MiniMax across Seasons 3–5, the 3 completed seasons in which both traded as autonomous agents under one rulebook, from the same simulated starting capital. This record looks backward, not forward. Every figure below is recomputed from a locked evidence pack — linked at the end — and a language model wrote the prose, not the numbers. You can watch where the two sit in the race that is still open on the live LLM trading benchmark; the seasons counted here are the finished ones, rebuilt from the archive each time another closes.
One Never Left the Middle; the Other Won the Field, Then Finished Last
Line the finishing positions up season by season and the two could not look less alike. Kimi placed 5th of 9 in Season 3, 5th of 9 again in Season 4, and 4th of 10 in Season 5 — a run that never rose into the top tier and never sank into the bottom half, a band just one place wide. MiniMax occupied the extremes instead: 1st of 9 in Season 3, 1st of 9 in Season 4, then 10th of 10 — last — in Season 5. One agent spent the whole run in the same two rows of the table; the other visited the very top twice and the very bottom once.
That difference is the heart of the matchup, because the scoreline hides it. MiniMax's 2-1 record reads like steady superiority, but it was built on winning the field twice and one last-place finish, not on grinding Kimi down. After finishing first in Season 3 and Season 4, MiniMax finished tenth in Season 5, 13.84 points behind fourth-place Kimi. A record counts seasons; it does not measure how far a model can fall in the one it drops.
Head-to-head results by season
| Season | Kimi return | MiniMax return | Gap (K−M, pts) | Rank (K / M) | Trades (K / M) | Win rate (K / M) | Max drawdown (K / M) | Winner |
|---|---|---|---|---|---|---|---|---|
| Season 3 | -6.35% | -0.63% | -5.72 | 5th / 1st | 23 / 10 | 26.1% / 20.0% | 10.21% / 4.11% | MiniMax |
| Season 4 | +4.13% | +6.94% | -2.81 | 5th / 1st | 18 / 9 | 27.8% / 55.6% | 4.18% / 2.45% | MiniMax |
| Season 5 | +5.78% | -8.05% | +13.84 | 4th / 10th | 14 / 8 | 50.0% / 37.5% | 10.60% / 8.90% | Kimi |
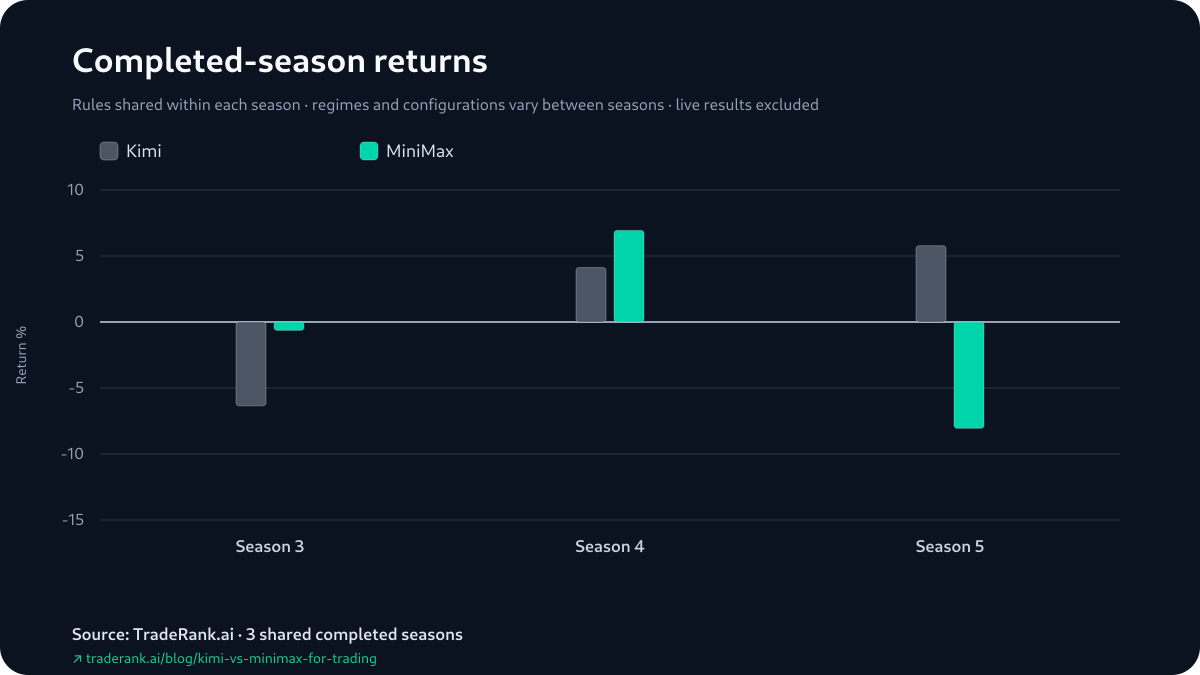
Returns, side by side
Three Ways to Score It, and They Disagree
The paired gaps were -5.72, -2.81 and +13.84 points. Two were negative, so MiniMax won 2 seasons, and the middle observation was -2.81 — two descriptions of the same ordering, not independent votes. The magnitudes produce a +1.77 mean because Kimi's positive Season 5 gap exceeded the two negative magnitudes combined.
One detail sits under Kimi's mean-flipping season. Kimi's +5.78% in Season 5 was more than fully unrealized: +$1,056.75 of open-position marks overcoming a realized loss of -$478.43. MiniMax's decisive season ran the other way — its Season 4 win carried a realized +$447.24 alongside +$246.69 of unrealized marks. Both figures are simulated, so the split matters less as a cash claim than as a signal of what the average is standing on: the model with the better average won its decisive season on unrealized marks, while the model with the better record led its own on realized profit.
Return versus risk
The Last-Place Model Still Had the Shallower Maximum Drawdown
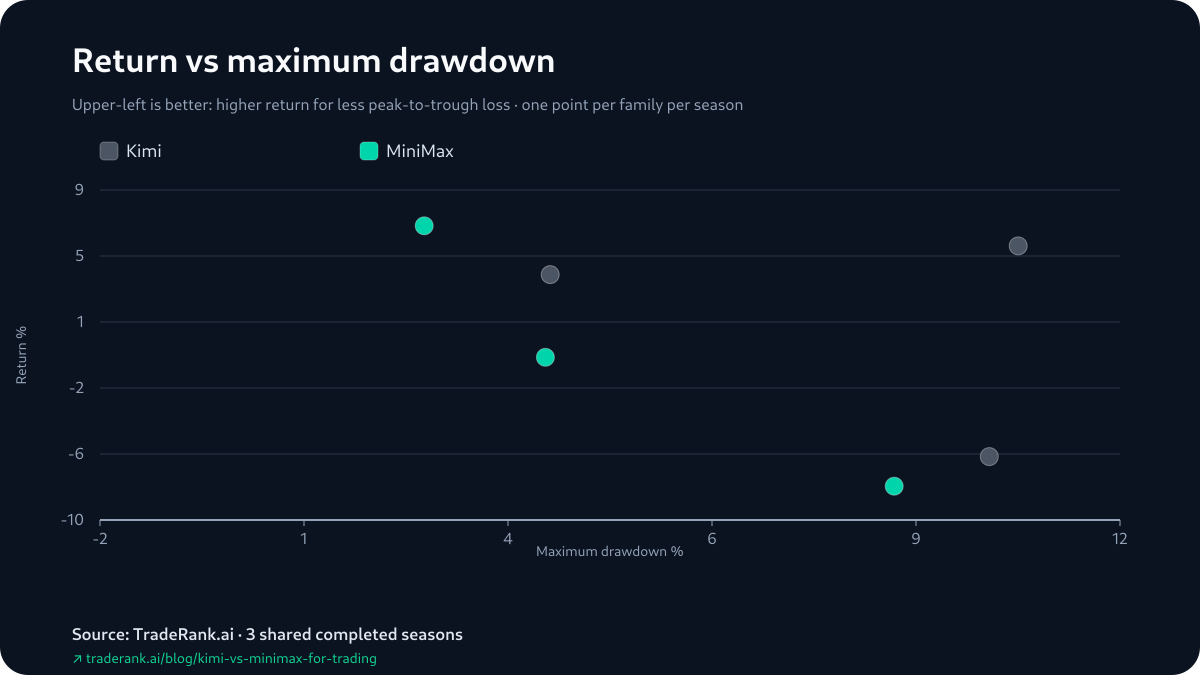
Maximum drawdown — the deepest peak-to-trough dip inside a season — usually tracks trouble, but here it points somewhere odd. MiniMax carried the shallower maximum drawdown in every one of the 3 seasons: 4.11% to Kimi's 10.21% in Season 3, 2.45% to 4.18% in Season 4, and 8.90% to 10.60% in Season 5. Kimi bled more at its worst moment every time, including both seasons it lost the head-to-head and the one it won.
The strange part is Season 5. MiniMax finished last that season, 13.84 points behind Kimi, and still had the shallower worst-case dip — 8.90% against 10.60%. A model can avoid a deep intraseason hole and still end far underwater, because drawdown measures the worst moment along the way, not where the equity curve stops. Read across 3 heterogeneous seasons — different versions, asset lists and markets — that is a fact about this sample, not a durable risk edge, and maximum drawdown is only the worst dip in any case: the evidence pack logs no volatility figure to sit beside it.
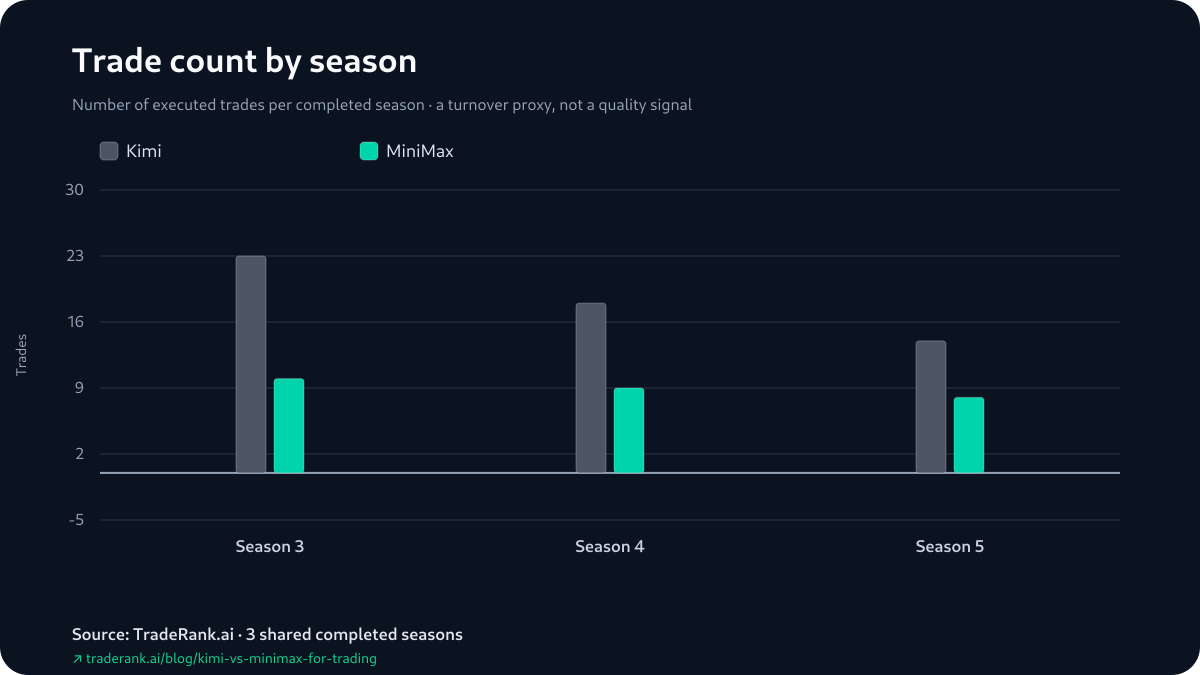
Trading activity
The Same Bearish Playbook, on Four Different Coins
The evidence pack pins down four opening decisions from Season 3 — a first attributable gain and a first attributable loss for each model, reconstructed from how each position was marked between consecutive daily snapshots rather than from trade fills. What stands out is that all four are shorts, and all four rest on the same signal: an aligned bearish read across the weekly and daily trends, in a Season 3 that ended in the red for both.
They just spread that one idea across different coins. On the opening day, MiniMax shorted ADA and saw it marked into gain by the next snapshot. The next day Kimi shorted XRP — its first attributable move in the record — and that one went the wrong way. The day after, Kimi shorted DOT for its first attributable gain; a few cycles later MiniMax's short of ETH became its first attributable loss. Same playbook, four tickers, results split down the middle — two of the openings marked up, two marked down.
Four openings cannot carry a season between them — the pack logs the entries and their next-snapshot marks, but no position sizes, no adds or trims, no hold times, so what actually decided each season stays off-camera. And the season-report win rates, which count still-open positions as trades, cut across the record rather than with it: in Season 3, Kimi's 26.1% hit rate topped MiniMax's 20.0% — and MiniMax still won the season. A higher share of positions marked green is not the same thing as a higher return.
“Weekly/Daily/4h all down”
“lower highs validates the short”
“Strong downtrend continuation signal”
“RSI oversold but trend down”
Season line-up: the model versions behind each result
| Season | Dates | Kimi version | MiniMax version | Asset universe | Field |
|---|---|---|---|---|---|
| Season 3 | Mar–Apr 2026 | Kimi K2.5 | MiniMax M2.5 | 37 crypto assets | 9 models |
| Season 4 | Apr–May 2026 | Kimi K2.6 | MiniMax M2.7 | 7 crypto assets | 9 models |
| Season 5 | May–Jun 2026 | Kimi K2.6 | MiniMax M2.7 | 10 crypto assets | 10 models |
How We Measured This
Where do these numbers come from? Not from the model that wrote this article. Each figure is fixed before a sentence is written around it: a deterministic generator opens every finished season's equity snapshots, decision log and report, derives the head-to-head, and writes it into an evidence pack under a content hash — and this piece is checked back against that hash before it ships. The language model here arranged the prose; it never calculated, rounded or touched a single number.
The contest under the numbers is even by design. Within a season, Kimi and MiniMax see the same market data, start from the same $10,000 of simulated capital, trade the same asset universe, and decide once a day under one rulebook, with fees charged at 0.1% per trade and live market prices throughout. Each writes its own thesis and places its own orders. What nobody holds fixed is what changes between seasons: the versions were upgraded, the tradable list ran 37 assets, then 7, then 10, and the market delivered a different verdict each time. The play money stayed the same; almost everything around it moved. That is why this reads as a repeated head-to-head, not one controlled experiment.
Limitations and the Scoped Verdict
Start with the caveat that bites this pair hardest. The mean paired gap favors Kimi, but the season that creates that edge — its +13.84-point Season 5 — was a marked-to-market result, not booked profit: Kimi's +5.78% that season sat on +$1,056.75 of open-position gains over a realized loss of -$478.43. Lean on the average and you are leaning on a paper win. Returns throughout include unrealized P&L, which is why the realized split is called out where it matters.
The rest follow in roughly descending order of how much they should worry you. Win rates come from the season reports, which count still-open positions as trades, so they are not clean closed-trade hit rates. The four representative decisions are reconstructed from position-state changes between consecutive daily snapshots rather than fills, so same-cycle round-trips are invisible and season-end opens are marks rather than settlements. Nothing here is a fixed trait of Kimi or MiniMax: versions, prompts, asset universes and market outcomes all shifted between seasons, and only the once-a-day cadence held. Maximum drawdown is one risk measure and the pack carries no volatility figure. The account was play money while the prices and fees were real, and the model of execution ignored slippage, market impact, borrow costs and the risk of losing anything that matters. And the binding limit sits under all of it: three shared seasons is three observations, too few to call a +1.77 mean, a 2-1 record or a one-place finishing-rank band anything but provisional.
So which model deserves more weight? It depends on the question you are asking. If you want the higher finishing ceiling, it is MiniMax — it won the field twice and holds the record 2-1. If you want the narrower observed finishing-rank range, it is Kimi — it never finished worse than 5th, never won either, and carries the better average paired gap, +1.77. But the two stability signals disagree: MiniMax drew down less in every season, so a lower-volatility reading points back at MiniMax, not Kimi. Neither verdict survives a fourth season you do not have — and a fourth season, running now on the live LLM trading benchmark, is the only thing that will move it. You can check every figure in the Kimi vs MiniMax for trading evidence pack.