The Qwen vs GLM for trading question has a one-line answer and a longer one. The one-line: across the 3 shared TradeRank seasons, Seasons 3–5, Qwen finished ahead of GLM in every season — a 3-0 head-to-head. The longer one is what that 3-0 is and is not. It is a return result on 3 observations, over a stretch where the model builds, the tradable list and the market outcome all changed from each season to the next; Qwen is Alibaba's model, GLM is Zhipu AI's, and both traded as autonomous agents off one $10,000 stake under a single rulebook, not as anyone's advice. Every figure here comes out of a hash-locked evidence pack — linked below — not out of a model; each time a season closes, the pack is regenerated from the archive and this page reissued to match.
Qwen vs GLM for Trading: One Direction on Return, Three Unlike Seasons
The running version of this question belongs to the live LLM trading benchmark; what follows is the closed ledger underneath it, and nothing in it moves. Read the 3 seasons in order and the return order never changes. Season 3 closed red for both — Qwen -2.73%, GLM -7.67%, a Qwen edge of +4.94 points (every gap here is Qwen minus GLM). Season 4 turned green for Qwen alone, +2.72% against GLM's -0.57%, a +3.29-point margin. Season 5 widened it: Qwen +4.95% and 5th in a field of 10, GLM -1.90% and 9th, a +6.86-point gap, the largest of the run. Qwen won Season 3, won again in Season 4, and won again in Season 5 — a 3-0 assembled across the run, and the pack's rank-reversal count between the two stands at 0. Summarize those three gaps and the median is +4.94, the mean +5.03; they are the same three margins condensed two ways, both landing on Qwen, not two separate verdicts. One note on the field ranks: a season's place falls straight out of its return by arithmetic, so 5th against 9th restates the return order in the standings rather than confirming it a second time.
Head-to-head results by season
| Season | Qwen return | GLM return | Gap (Q−G, pts) | Rank (Q / G) | Trades (Q / G) | Win rate (Q / G) | Max drawdown (Q / G) | Winner |
|---|---|---|---|---|---|---|---|---|
| Season 3 | -2.73% | -7.67% | +4.94 | 3rd / 7th | 23 / 20 | 30.4% / 20.0% | 7.96% / 9.46% | Qwen |
| Season 4 | +2.72% | -0.57% | +3.29 | 7th / 9th | 15 / 7 | 26.7% / 28.6% | 3.41% / 0.75% | Qwen |
| Season 5 | +4.95% | -1.90% | +6.86 | 5th / 9th | 14 / 23 | 50.0% / 39.1% | 7.99% / 7.45% | Qwen |
Returns, season by season
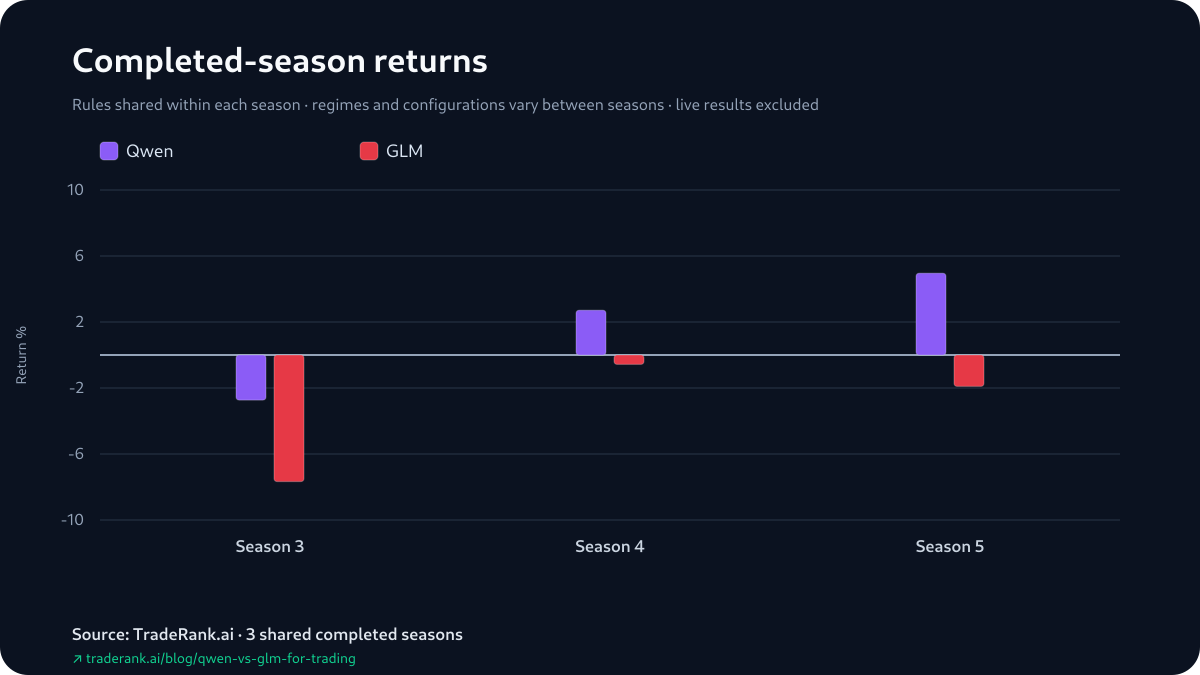
GLM Finished Every Shared Season in the Red
The line that carries the sweep is GLM's own column: it did not close a single shared season above water. GLM posted -7.67% (Season 3), -0.57% (Season 4) and -1.90% (Season 5) — negative all 3 times, and by field placement a 7th of 9, then 9th of 9, then 9th of 10 — the foot of the field in Season 4 and one place off it in Season 5. Qwen was not always in profit either; its -2.73% in Season 3 was a loss, and its win that season was only the less-negative of two red books. But from Season 4 on, Qwen crossed into profit twice while GLM posted a loss every season, and that is the shape of the 3-0. It is still a return result on 3 seasons, and the sections below show how little the other columns back it.
Return against maximum drawdown
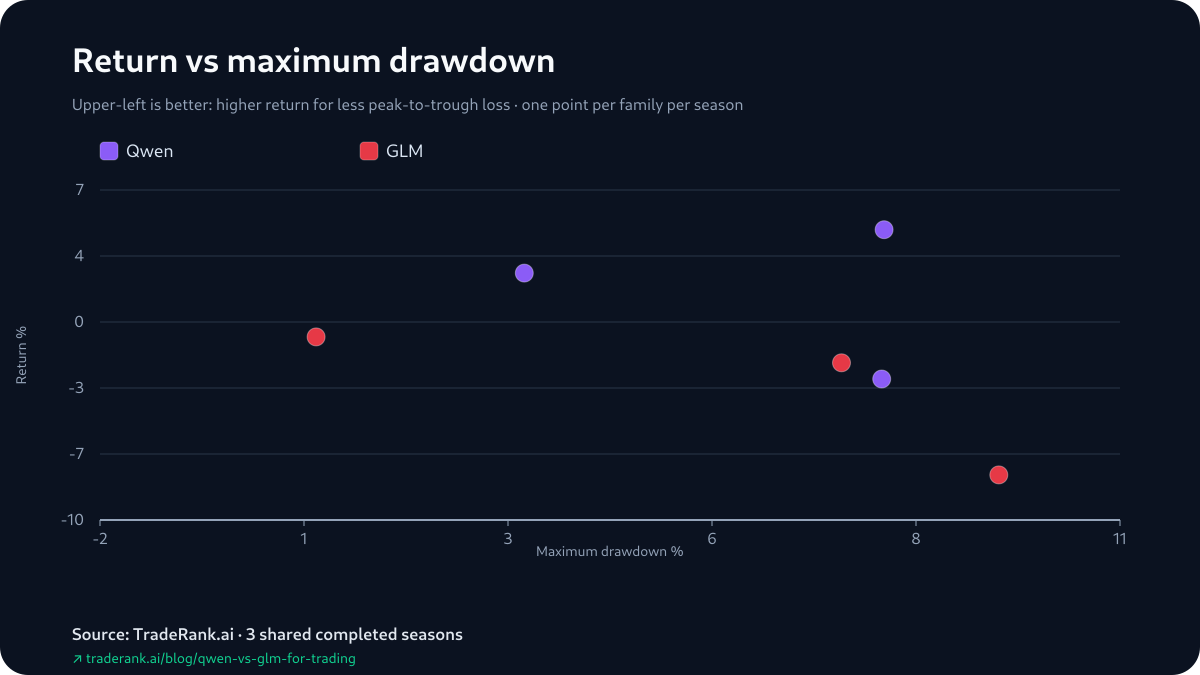
The Sweep Did Not Reach the Drawdown Column
Set the maximum drawdowns beside the record and they do not sort both models the same way. Qwen finished ahead every season, yet its deepest peak-to-trough fall was the larger of the two in Season 4, 3.41% to GLM's 0.75%, and again in Season 5, 7.99% to 7.45%; GLM's was the larger only in Season 3, 9.46% to 7.96%. So the model that won on return took the deeper drawdown, by this one measure, in Season 4 and in Season 5 — the risk column and the head-to-head simply did not line up. That is description rather than a rule: maximum drawdown is a single worst-moment number, the pack carries no volatility series next to it, and on 3 seasons one slot landing on the deeper dip most of the run is as easily these particular months as anything about the model.
What Had Settled in Qwen's Widest Win
A season's return still carries open positions at their last marks, so the headline figure and the cash actually booked are separate readings — and Season 5, Qwen's widest-margin win, is where they part. Qwen's +4.95% that season rested on unrealized marks: a realized -$623.91 underneath +$1,119.37 of open gains, netting a positive total. GLM's -1.90% was a loss overall — a booked -$488.16 under +$297.85 of open marks — but its realized figure was the less-negative of the two booked results, so on settled cash alone, in the very season Qwen won by the most, GLM's book closed nearer to flat. The earlier seasons ran the other way on the settled side: Qwen booked a realized -$337.21 to GLM's -$721.59 in Season 3, and a realized +$170.31 — its only positive booked season — against GLM's -$65.46 in Season 4. None of this moves the 3-0; every return in the table is the official mark-to-market figure, and Qwen finished ahead in all 3. It only marks where each number stood when the season ended, both accounts simulated throughout.
How Each Model Opened the Run
The pack keeps each model's first attributable gain and first attributable loss, reconstructed from day-to-day position states rather than fills, and for this pair all of them sit in Season 3's opening days. Both models opened the same way: a short on ADA in the first cycle, logged seconds apart, and by the next daily snapshot each was carrying that ADA short in gain — one opening trade, one shared early result. Their first losses split. GLM's came from a second short opened in that same first cycle, on ARB, which the next snapshot marked down — so its earliest gain and earliest loss were a pair of opening-day shorts, one paid, one charged. Qwen's first loss was an upside bet, opened later in the stretch — a long on HYPE that sat in loss by the following snapshot. So the archive's first divergence is the losing trade, not the winning one: GLM opened short on both, Qwen reached for an upside bet. Hold it to what an opening cycle can carry — a handful of decisions out of full seasons of them, no position size, no adds or trims, no hold-time in the record — and it says nothing about the weeks that actually built the 3-0.
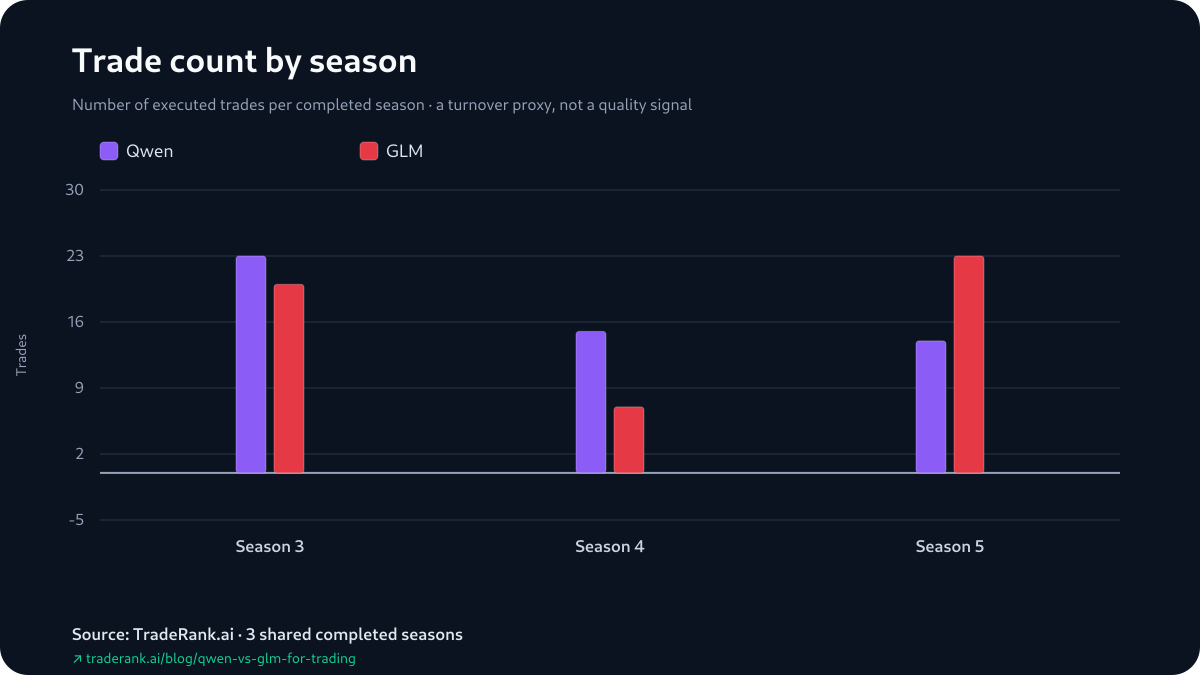
Trade count by season
Season line-up: the model versions behind each result
| Season | Dates | Qwen version | GLM version | Asset universe | Field |
|---|---|---|---|---|---|
| Season 3 | Mar–Apr 2026 | Qwen 3.5 Plus | GLM-5 | 37 crypto assets | 9 models |
| Season 4 | Apr–May 2026 | Qwen 3.6 Plus | GLM-5.1 | 7 crypto assets | 9 models |
| Season 5 | May–Jun 2026 | Qwen 3.6 Plus | GLM-5.1 | 10 crypto assets | 10 models |
How This Was Measured
Every number on this page resolves to one archived file, and none of it was written by a model. A deterministic generator extracts each completed season's report, decision log and equity snapshots, recalculates every return, rank, drawdown and realized/unrealized figure, and attests the result under a content hash — the same inputs yielding the same rows on every run, with the article's copy checked back against that hash before it ships. A language model only arranges the locked figures into sentences. Within a single season the conditions were level: Qwen and GLM read the same market data, each staked the same $10,000 of simulated capital, traded the same asset list on the same daily clock, and filled at live prices under a modeled 0.1% fee per trade, with slippage, borrow costs and market impact absent from the simulation. Each then wrote its own thesis and sent its own orders. What no season could equalize is what shifted between them — the builds, the prompt, the tradable list running 37, then 7, then 10 names, and the market outcome — which is why this reads as a repeated head-to-head across 3 seasons rather than one controlled experiment.
Limitations, and the One Column the Sweep Lives In
The frame for the whole 3-0 is that it lives in one column. Qwen won the return in every shared season; the risk column leaned the other way in Season 4 and Season 5, the activity column changed hands in Season 5, and the win-rate column — which the reports build with still-open positions counted as trades, so it is not a closed-trade hit rate — is not a scoreboard at all. Score the pair by return and Qwen sweeps; that is the one measure the head-to-head uses, and it is worth knowing it is only the one. The sample binds everything else: 3 shared completed seasons is 3 observations, and GLM ran as GLM-5 then GLM-5.1 while Qwen ran as 3.5 then 3.6 Plus, each season on a different asset list into a different market, so nothing here is a fixed trait of either model. The metrics carry their own limits: returns fold in unrealized P&L, which is why Qwen's Season 5 +4.95% is split from its -$623.91 realized book above; the opening decisions come from daily position states rather than fills, so a within-cycle round-trip never shows; and neither hold-time nor profit factor holds a trustworthy archive value, so both are left off the page instead of guessed. What is left is small and clean: Qwen ahead in all 3 shared seasons on return, a loser that never turned green, and a set of risk and activity columns that decline to follow the record. You can check every figure in the Qwen vs GLM for trading evidence pack.