The number that brings most readers here is the head-to-head, so take it first: across the 3 shared TradeRank seasons, Qwen finished ahead of Claude in every one — a 3-0 result. Then weigh what that 3-0 is worth. It rests on 3 seasons, which is 3 observations, and the model builds, the tradable list and the market outcome all turned over from one to the next. This Claude vs Qwen for trading comparison works a closed, deliberately partial archive — Seasons 3–5, the shared stable-roster stretch in which the Anthropic slot (Claude Opus 4.6, then Claude Opus 4.7) and the Alibaba slot (Qwen 3.5 Plus, then Qwen 3.6 Plus) traded the same crypto off one $10,000 stake under a single rulebook — not TradeRank's full completed-season history. Every number here is read back from a hash-locked evidence pack — linked at the foot of this page — never authored by a model; when a season completes, the figures are regenerated from the archive and this page is reissued.
Season line-up: the builds behind each 3-0 leg
| Season | Dates | Claude version | Qwen version | Asset universe | Field |
|---|---|---|---|---|---|
| Season 3 | Mar–Apr 2026 | Claude Opus 4.6 | Qwen 3.5 Plus | 37 crypto assets | 9 models |
| Season 4 | Apr–May 2026 | Claude Opus 4.7 | Qwen 3.6 Plus | 7 crypto assets | 9 models |
| Season 5 | May–Jun 2026 | Claude Opus 4.7 | Qwen 3.6 Plus | 10 crypto assets | 10 models |
Head-to-head results by season
| Season | Claude return | Qwen return | Gap (Claude−Qwen, pts) | Rank (Claude / Qwen) | Trades (Claude / Qwen) | Win rate (Claude / Qwen) | Max drawdown (Claude / Qwen) | Winner |
|---|---|---|---|---|---|---|---|---|
| Season 3 | -7.61% | -2.73% | -4.87 | 6th of 9 / 3rd of 9 | 24 / 23 | 8.3% / 30.4% | 8.82% / 7.96% | Qwen |
| Season 4 | +0.88% | +2.72% | -1.83 | 8th of 9 / 7th of 9 | 12 / 15 | 25.0% / 26.7% | 3.64% / 3.41% | Qwen |
| Season 5 | +2.67% | +4.95% | -2.28 | 6th of 10 / 5th of 10 | 13 / 14 | 69.2% / 50.0% | 11.69% / 7.99% | Qwen |
Returns, season by season
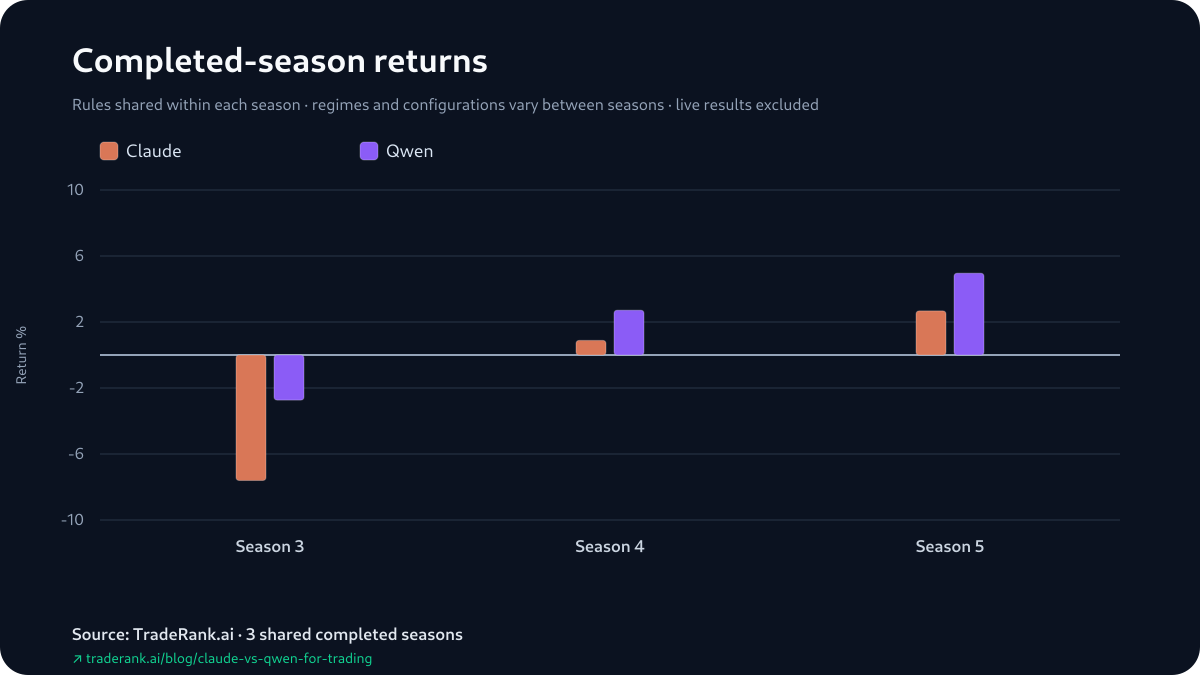
Claude vs Qwen for Trading: A 3-0 Sweep Made of Two Climbs
How both slots are trading now is a live matter, and the live LLM trading benchmark is where that sits; this page is the settled archive behind it, and nothing on it moves. Read the 3 seasons in order and two things happen at once. Each model's return improves on the season before — Claude from -7.61% to +0.88% to +2.67%, Qwen from -2.73% to +2.72% to +4.95% — and at every stop Qwen's number is the higher of the two, so the head-to-head reads 3-0 without a single reversal. The margin between them is not what climbs, though: taken as Claude minus Qwen, the season gaps ran -4.87, then -1.83, then -2.28 points — the -4.87 in Season 3, the lone season both models finished in the red; the -1.83 and -2.28 in the seasons both finished green. Summarized, the gaps give a median of -2.28 and an average of -3.00, the average dragged a little further out by Season 3's -4.87, the largest of the 3. They are two compressions of the same 3 gaps, both leaning Qwen's way, not two separate readings.
One column on the results table is not the independent second opinion it looks like. TradeRank ranks the whole field by return, so Qwen's placement and its paired-return result are one fact read from two directions — 3rd of 9 against Claude's 6th of 9 in Season 3, 7th of 9 against 8th of 9 in Season 4, 5th of 10 against 6th of 10 in Season 5. The ranks say how high up the field each finish sat, not who beat whom a second time; Qwen finished above Claude in all 3, and the order between them never flipped.
How Much of Qwen's 3 Wins Had Actually Settled
Because a season's return still carries open positions at their live marks, what a model showed and what it settled are two separate figures — and Qwen's 3 wins answer them differently. Season 3 was a loss for both, and Qwen simply lost less: a realized -$337.21 with a small +$63.82 open mark on top, -$273.39 in total, against Claude's -$760.69. Season 4's win was positive on both books — a realized +$170.31 under a +$101.44 open mark, +$271.75 — while Claude's +$88.27 leaned the other way, +$458.12 of open gains over a realized -$369.85. Season 5 is where the split is widest. Qwen's +4.95%, its best return of the run, was more than fully unrealized — a realized -$623.91 sat beneath +$1,119.37 in open marks, netting to +$495.46. Claude, which lost that season on return, was the one closing into booked gains — a realized +$324.41 held against a -$57.40 open mark, +$267.01 in all. None of this unwinds the 3-0; every one of those returns is the official marked-to-market figure, and Qwen won all 3. It places Qwen's biggest win on its least-settled book, with both accounts simulated throughout.
Return against maximum drawdown
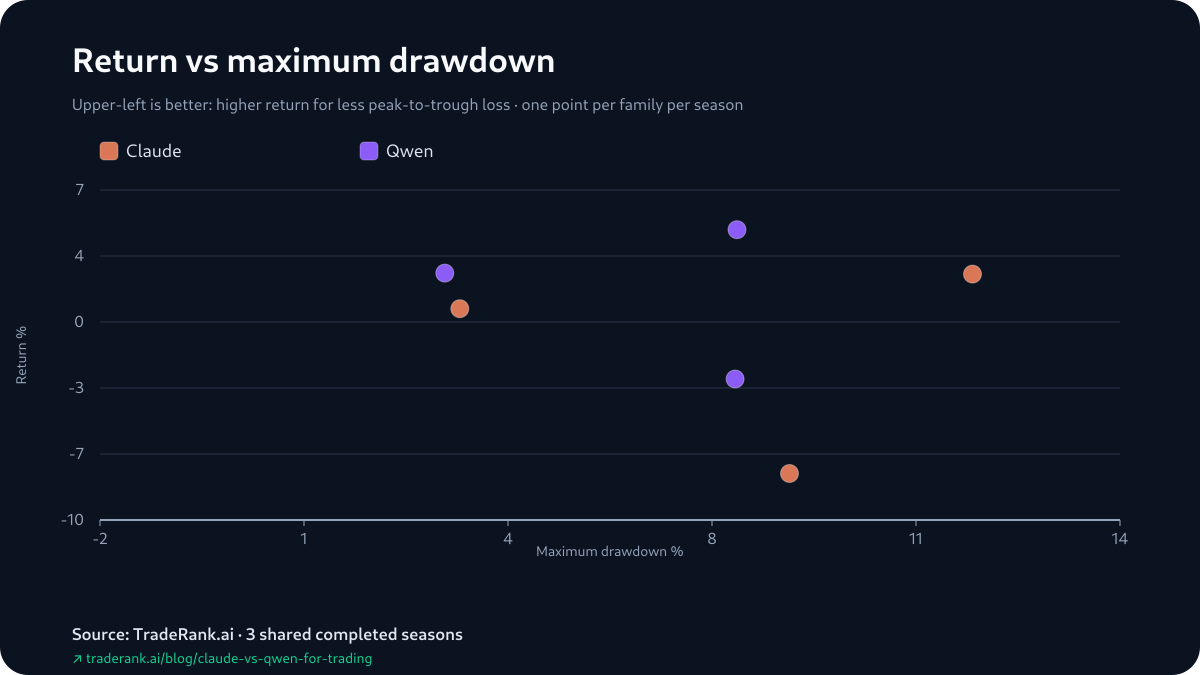
Qwen's Shallower Drawdown, and Why It Is Not a Second Win
The one risk figure the pack holds is maximum drawdown, and here it leans the same way as the returns: Qwen's deepest peak-to-trough fall was the smaller of the two in every season — 7.96% against Claude's 8.82% in Season 3, 3.41% versus 3.64% in Season 4, and 7.99% against 11.69% in Season 5. It is tempting to bank that as a second axis Qwen also won, but hold it lightly. Maximum drawdown is a single worst-moment figure, the pack carries no volatility series to set beside it, and across 3 seasons one slot landing on the lower drawdown each time is as easily a coincidence of these particular months as a durable trait. What it does add is texture: Season 5 is where the drawdown gap between the two sits widest, 7.99% to 11.69%, and Season 4 is where it sits narrowest, 3.41% and 3.64%. Useful color on how each result was reached, not a separate scoreboard stacked on top of the returns.
Both Started Short on the Same Coin — Then Diverged
The pack keeps each slot's first attributable gain and first attributable loss, and the two lines start from the same opening decision, logged moments apart in Season 3's first cycle: Claude (Claude Opus 4.6) and Qwen (Qwen 3.5 Plus) each opened a short on ADA. Claude's note read the downtrend as aligned across the weekly, daily and four-hour timeframes; Qwen's cited the weekly and daily trends pointing the same way. By the next daily snapshot both were carrying that ADA short in gain — the same opening move, the same early result. Where they part is the first stumble. Claude's first attributable loss stayed on the short side, a UNI short opened in the same cycle that the next snapshot marked down. Qwen's came from the opposite direction and a little later in the opening stretch — a long on HYPE that the next snapshot put underwater. So the archive's first divergence between them is not the winning trade, which they shared, but the losing one: one stayed bearish, the other reached for an upside bet.
Keep it to what a first cycle can hold. A handful of opening decisions, out of full seasons of them, says nothing about the weeks that set the 3-0 — and the pack logs no position size, no adds or trims, no hold-time to join the dots. What is on the record is a shared opening winner and a split on the first loss, and it stops there.
Trade count by season
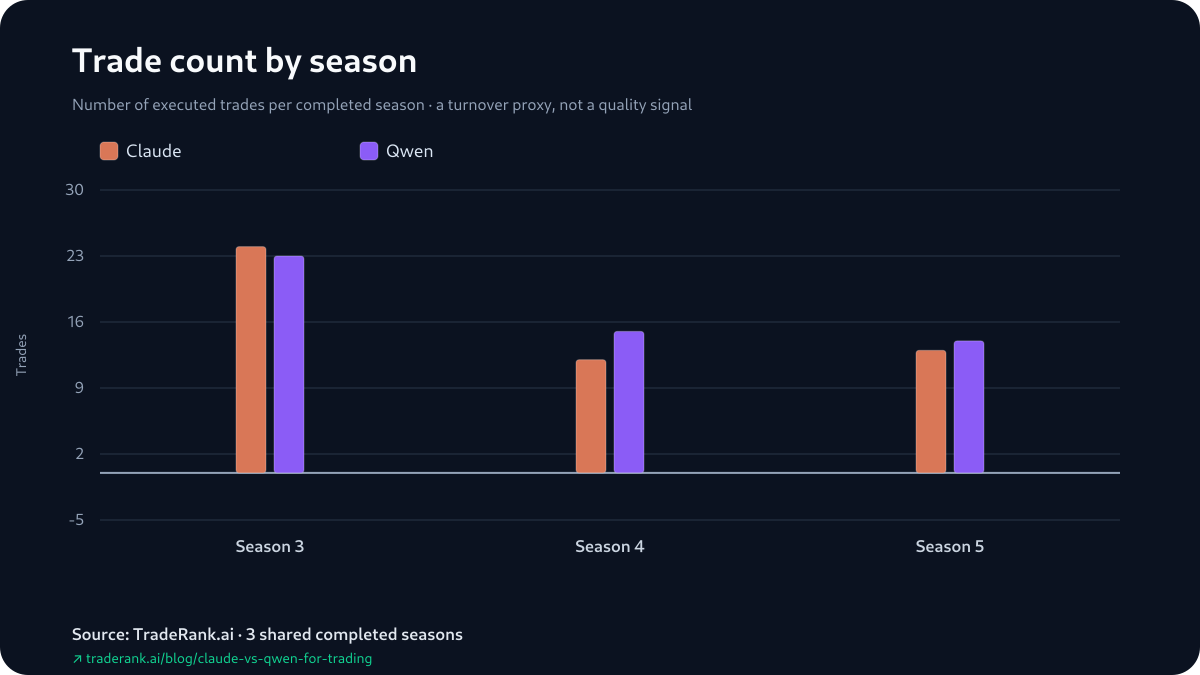
Claude's Win Rate Climbed to 69.2% and It Still Lost All 3
No column on the table invites a bigger story than the win rate, and no column supports one less. Claude's reported figure climbed hard across the run — 8.3% in Season 3, 25.0% in Season 4, 69.2% in Season 5 — and by Season 5 it had passed Qwen's outright, 69.2% to 50.0%. None of that touched the head-to-head: Claude lost all 3 seasons, the 69.2% one included. Two things keep the cell from meaning what it looks like it means. The reports build these percentages with positions still open at the bell counted as trades, so every figure here sits above what a closed-trades-only count would show. And being right on a larger fraction of positions says nothing about their size — a few heavy losers can outweigh a long tail of small winners. Qwen's rate took no straight path — 30.4%, then 26.7%, then 50.0% — while it won every season, which is the plainest sign that across these 3 seasons the hit rate and the result simply ran on separate tracks.
How We Measured This
It helps to split this into two jobs that never overlap. The generator's job is the arithmetic: a deterministic program reads each archived season's report, decision log and equity snapshots, works out every return, rank, drawdown and realized/unrealized figure, and writes them into the evidence pack under a content hash — the same inputs producing the same rows on every run. The writer's job is only to arrange those locked figures into sentences; the prose reproduces the pack's numbers and the build step confirms the copy against that hash before it ships, so no figure on this page was produced by a language model — only arranged by one. Within a season nothing that could be equalized was left uneven: each slot took one $10,000 simulated stake, one daily decision schedule, one asset list and one price feed, and from there wrote its own thesis and sent its own orders, filled at live prices with a modeled 0.1% fee per trade; slippage, borrow costs and market impact are absent from the simulation. What shifted between seasons — which builds ran, which coins were tradable, how the market broke — is named on the page rather than averaged away, because those shifts are exactly what a 3-season head-to-head cannot hold still.
Limitations, and the 3 Things That Changed Under the Record
The record sits on three moving parts, and naming them frames the whole 3-0. The versions first: 'Claude' is Opus 4.6 in Season 3 and Opus 4.7 after; 'Qwen' is 3.5 Plus in Season 3 and 3.6 Plus after — two builds a side, not one fixed model per name. The universe next: the tradable list ran 37 crypto assets in Season 3, 7 in Season 4 and 10 in Season 5, so each leg of the sweep was contested on a different board. And the market outcome itself: Season 3 finished red for both, Season 4 and Season 5 green for both, which is why the season gaps were widest in the red one. Change any of the three and both return paths could keep their shape or lose it, with nothing about either model having moved.
Then the measurement caveats. Because returns absorb unrealized P&L, a season's headline can sit some distance from its settled book — Qwen's Season 5 +4.95%, standing on +$1,119.37 of open marks against a realized -$623.91, is the case in point. Win rates here fold in positions that were still open at the close, so they sit above a closed-only hit rate. The opening decisions are rebuilt from position states between daily snapshots, not fills, so a same-cycle round-trip leaves no mark. Hold-time and profit factor have no dependable archive values and are omitted rather than guessed. What is left is a clean but small record: Qwen ahead in all 3 shared seasons, both models improving season over season, and the winning margin never widening past Season 3's -4.87. Every figure sits in the Claude vs Qwen for trading evidence pack — 3 seasons, two builds a side, a 3-0 that reads as two parallel climbs rather than a widening gulf.