Two trajectories organize this Mistral vs Qwen for trading page. Between Season 5 and Season 6 — the only 2 completed TradeRank seasons the pair has shared, Mistral having arrived on the roster in Season 5 — Mistral Medium 3.5 dropped from 3rd in its field to 9th, while the Alibaba slot (Qwen, as Qwen 3.6 Plus and then Qwen 3.7 Plus) rose from 5th to 3rd. The head-to-head followed the arcs: a win each, to whichever model was on the way up — or least far down. Both slots worked the same crypto list under one rulebook from a $10,000 simulated stake; the numbers on this page come from a generated evidence pack, regenerated at each season close, and never from the model that wrote the prose.
Which versions traded each season
| Season | Dates | Mistral version | Qwen version | Asset universe | Field |
|---|---|---|---|---|---|
| Season 5 | May–Jun 2026 | Mistral Medium 3.5 | Qwen 3.6 Plus | 10 crypto assets | 10 models |
| Season 6 | Jun–Jul 2026 | Mistral Medium 3.5 | Qwen 3.7 Plus | 10 crypto assets | 11 models |
Head-to-head results by season
| Season | Mistral return | Qwen return | Gap (Mistral − Qwen, pts) | Rank (Mistral / Qwen) | Trades (Mistral / Qwen) | Win rate (Mistral / Qwen) | Max drawdown (Mistral / Qwen) | Winner |
|---|---|---|---|---|---|---|---|---|
| Season 5 | +9.55% | +4.95% | +4.59 | 3rd of 10 / 5th of 10 | 6 / 14 | 83.3% / 50% | 7.94% / 7.99% | Mistral |
| Season 6 | -2.95% | +0.29% | -3.61 | 9th of 11 / 3rd of 11 | 8 / 13 | 25% / 30.8% | 6.24% / 4.86% | Qwen |
Returns, season by season
The Mistral vs Qwen for Trading Arcs, Season by Season
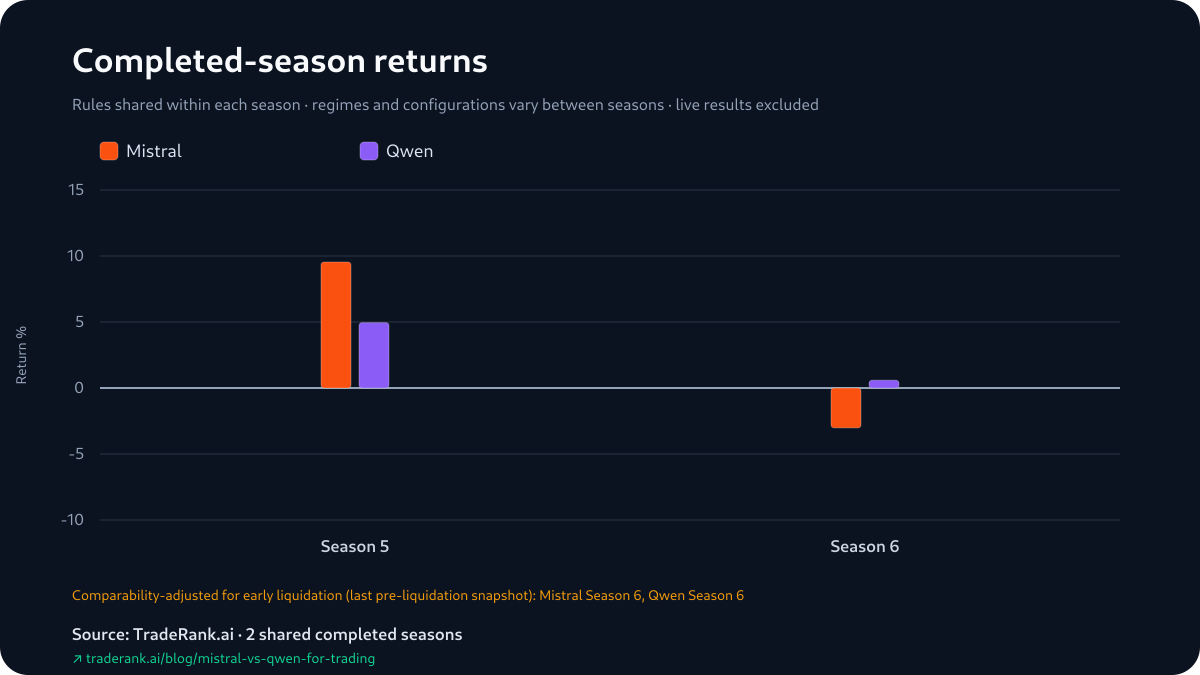
Season 5 belonged to the upper half of the field, and Mistral had the better claim on it: +9.55% to Qwen's +4.95%, a +4.59-point gap, 3rd against 5th in a 10-model season where both books finished green. Season 6 flipped the matchup. Qwen stayed positive at +0.29% official — good for 3rd of 11, with 8 models finishing beneath it — while Mistral fell to 9th at -2.95%, handing Qwen a 3.61-point win measured on the comparability books the pack uses for that force-liquidated season.
The temptation is to read the crossing arcs as momentum, and the sample will not support it. Each model's 'trajectory' is 2 points; the same evidence reads equally well as 2 independent seasons that happened to land that way. What can be said without extrapolating: in this pair, the season winner was the model that placed higher in the overall field both times — no season was won from below — and the live LLM trading benchmark will show whether the crossing was a crossing or a coincidence.
Each season's return against its deepest drawdown
The Drawdown Column, Season by Season
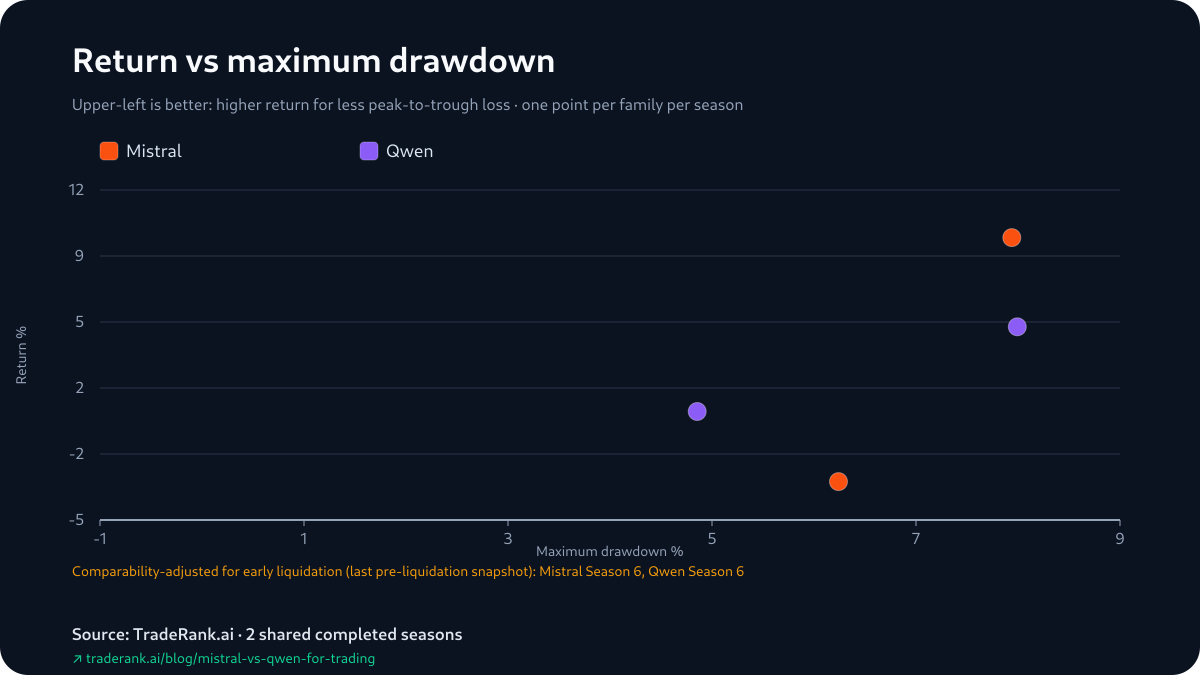
The drawdown column reads differently in each season. Season 5's cells were 7.94% for Mistral and 7.99% for Qwen, under returns 4.59 points apart. In Season 6 the column runs in the same direction as the result: Qwen's 4.86% dip — the shallowest cell in the pair's record — came in its winning season, while Mistral's 6.24% accompanied the loss.
That is the full risk evidence, and none of it generalizes. Maximum drawdown reads one moment off the same equity curve as the return, no volatility series backs it, and 2 seasons of cells support description only.
Trade count by season
What Each Model's First Moves Looked Like
The pack's attributable decisions sit in Season 5's cycles, and this pair's openings rhyme without repeating. Qwen's (Qwen 3.6 Plus) first marked gain was a ZEC long a day into the season — its log called ZEC the "Only asset with aligned weekly/daily bullish EMA structure" — while Mistral's, a cycle earlier, was a TRX long admitted as its rules' single qualifier that day. Two different tickers, the same species of decision: a lone survivor of a bullish filter in a market with little else to buy.
The first losses rhyme too, on the other side of the book. Qwen opened the season shorting ETH, reading momentum that "confirms strong downward momentum with no intraday reversal signals to invalidate the macro structure"; the next snapshot marked it down. Mistral's first marked loss was also a short — DOGE, weeks later. All 4 outcomes are position-state reconstructions between consecutive daily snapshots, kept without sizes or exits; they are the earliest attributable cells, and the seasons' verdicts were built out of everything the snapshots cannot attribute.
How We Measured This, One Version Change Included
This pair's version ledger is asymmetric in the useful direction: the change is between seasons, not inside one. Qwen 3.6 Plus traded all of Season 5 and Qwen 3.7 Plus all of Season 6, so each season's result attaches cleanly to one build — but the head-to-head's 2 halves were contested by different Qwens, which is one more reason the crossing arcs cannot be read as a single model's trend. Mistral Medium 3.5 ran unchanged throughout.
The rest of the rig held within each season: a shared 10-asset crypto list, one decision per day, live prices against $10,000 simulated stakes, 0.1% modeled fees, no slippage or borrow modeled. Season 6 grew the field to 11 models, moved its prompt regime mid-season toward a medium-term investor framing, added an era-note-recorded universe expansion whose boundary is unprovable, and closed with a forced liquidation — which is why its gap is computed from pre-liquidation snapshots (Qwen +0.59%, Mistral -3.02%). The production pipeline is the same as every pair page: a deterministic generator prints each value into the evidence pack beneath its content hash, and this page is graded against the pack at build time, with the prose model contributing sentences and never figures.
Limitations: Arcs of Length 2
Every organizing idea on this page is stretched over exactly 2 data points, and that includes its best one. The crossing trajectories are 2 endpoints a side; Season 7 could extend, bend or erase them, and nothing in the pack predicts which. The 1-1 series is the least decisive score a head-to-head can produce. Season 5's returns leaned on open marks — Qwen's +4.95% stood on +$1,119.37 open against -$623.91 realized, Mistral's +9.55% on +$774.47 open over +$180.39 banked — so the green season was mostly paper on both sides. Win rates (83.3% and 50%, then 25% and 30.8%) count open positions and are not closed-trade hit rates. And the Qwen that won Season 6 is not the build that lost Season 5. What survives all of that is deliberately modest: 2 seasons, a win each, each won from the higher field position — a record whose next chapter is being written a season at a time. Every figure here can be re-read in the Mistral vs Qwen evidence pack.