This Grok vs Qwen for trading comparison was locked at the close of Season 5, the last completed season in the set: the evidence pack behind the page carries a fixed snapshot, and it regenerates only when another season finishes and closes its books — so what you are reading has a date on it, and a refresh means a new pack, not a figure drifting under the page. Inside that window sit the 3 shared stable-roster seasons (Seasons 3–5) in which the xAI slot (Grok 4.20, then Grok 4.20 MA, then Grok 4.3) and the Alibaba slot (Qwen 3.5 Plus, then Qwen 3.6 Plus) traded the same crypto under one rulebook — and across them, Qwen holds the head-to-head 2-1. That is the narrow view by design: TradeRank has more completed seasons than the 3 read here, and its homepage benchmark spans every model; this page reads only the seasons the two shared. Neither model wrote a number on this page. The pack did — a locked file this page links at the end — and the prose only points at it.
The builds behind each badge, season to season
| Season | Dates | Grok version | Qwen version | Asset universe | Field |
|---|---|---|---|---|---|
| Season 3 | Mar–Apr 2026 | Grok 4.20 | Qwen 3.5 Plus | 37 crypto assets | 9 models |
| Season 4 | Apr–May 2026 | Grok 4.20 MA | Qwen 3.6 Plus | 7 crypto assets | 9 models |
| Season 5 | May–Jun 2026 | Grok 4.3 | Qwen 3.6 Plus | 10 crypto assets | 10 models |
Head-to-head results by season
| Season | Grok return | Qwen return | Gap (Grok−Qwen, pts) | Rank (Grok / Qwen) | Trades (Grok / Qwen) | Win rate (Grok / Qwen) | Max drawdown (Grok / Qwen) | Winner |
|---|---|---|---|---|---|---|---|---|
| Season 3 | -15.90% | -2.73% | -13.17 | 9th of 9 / 3rd of 9 | 22 / 23 | 27.3% / 30.4% | 19.72% / 7.96% | Qwen |
| Season 4 | +5.34% | +2.72% | +2.62 | 3rd of 9 / 7th of 9 | 18 / 15 | 16.7% / 26.7% | 7.34% / 3.41% | Grok |
| Season 5 | +0.48% | +4.95% | -4.47 | 7th of 10 / 5th of 10 | 15 / 14 | 46.7% / 50.0% | 7.27% / 7.99% | Qwen |
Returns, season by season
Grok vs Qwen for Trading: The Lead Never Stayed Put
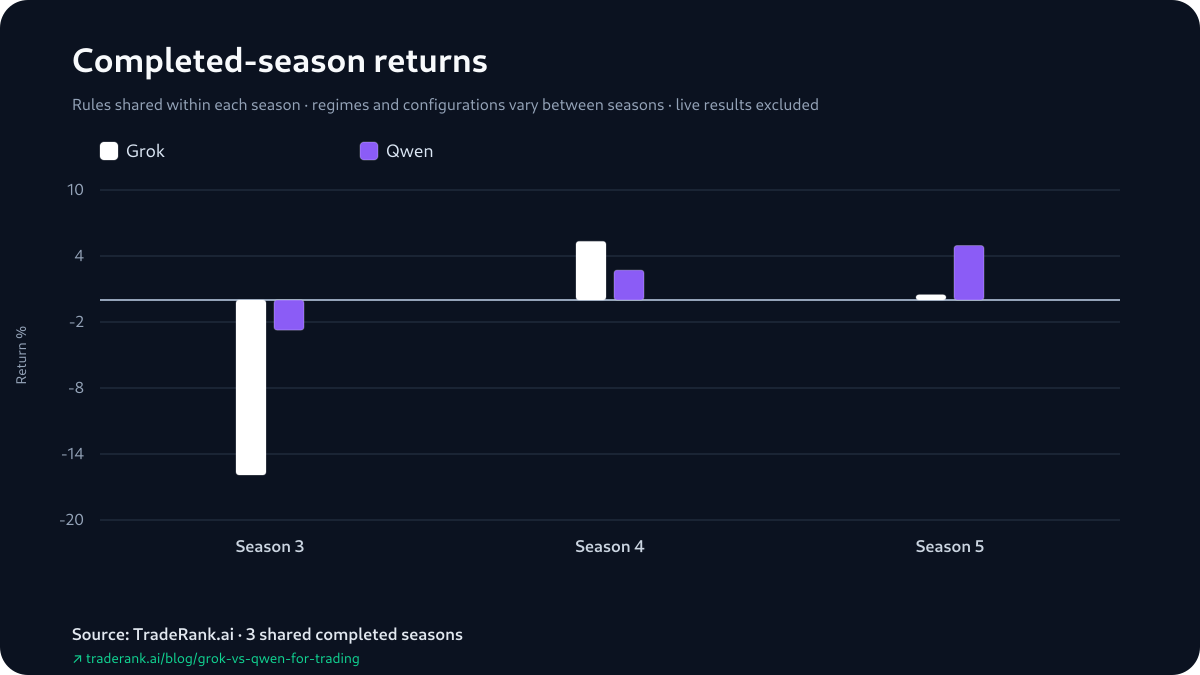
The live LLM trading benchmark shows where both slots stand today; nothing here moves, since this is the archive behind that view. Taken in order, the lead moved twice. Qwen won Season 3 by a distance — -2.73% to Grok's -15.90%, a gap of -13.17 points (every gap here is Grok minus Qwen). Grok won Season 4 by +2.62, the closest margin of the run, then Qwen won Season 5 by -4.47. The running count never got away from either side: Qwen held the edge after Season 3, Grok pulled it level in Season 4, and only Season 5 put Qwen back in front — a 2-1 that stayed open until the last season closed. The median gap, -4.47 points, and the average, -5.01, both sit on Qwen's side — though both summarize the same 3 season gaps, so their agreement adds no second piece of evidence. What actually moved was the size and the sign of the gap — a wide Qwen season, a narrow Grok one, a middling Qwen one — 3 adjacent margins that never pointed the same way twice.
The Standings Under These Two Never Sat Still
Set the win-loss line aside and look at where each slot landed in its field, because that is where Grok and Qwen actually moved. In Season 3 Grok finished 9th of 9 — last — while Qwen took 3rd of 9 in a season it closed down. The next season the picture had inverted: Grok climbed to 3rd of 9 and Qwen dropped to 7th of 9. By Season 5 they had drawn closer together but changed again — Grok 7th of 10, Qwen 5th of 10. Grok's best placement of the run (3rd of 9) and Qwen's worst (7th of 9) fall in the same season, Season 4 — the lone season Grok took the head-to-head. Qwen's best placement (3rd of 9) and Grok's worst (9th of 9) fall together too, in Season 3, which Qwen won. Read that carefully: field rank is a deterministic restatement of the same season return against the rest of the field, so it is not a separate scoreboard from the returns above — it is those returns, placed among the rest of the models. What it adds is only context, and the context is that the placements kept moving: neither slot held a rung from season to season.
How Much of Each Green Season Had Settled
Because the standings mark open positions at their last price, a season's headline return and the cash it had actually booked are separate readings — and here they separate most in the green seasons. Grok's Season 4 +5.34% stood on +$1,150.02 of open marks over a realized -$615.98, for a +$534.05 total; its Season 5 +0.48% was the same shape, +$887.80 open on a realized -$839.61, +$48.19 in all. Qwen's Season 5 +4.95% ran that way too — +$1,119.37 open over a realized -$623.91, +$495.46 total. The exception is Qwen's Season 4: a +$170.31 realized book beneath a +$101.44 open mark, +$271.75 total — settled in the black on both halves, in the season Qwen lost the head-to-head. Season 3 sat underwater throughout for both: Grok -$1,590.49 in total (-$1,528.36 realized under a -$62.13 mark), Qwen -$273.39 (-$337.21 realized under a +$63.82 mark). None of this re-scores a season. Return, open marks and all, is what the standings count, so Grok won Season 4 and Qwen won the other two; the realized column only shows how each result was assembled, and both accounts were simulated on either side.
Return against maximum drawdown
The Shallower Drawdown Didn't Choose the Winner
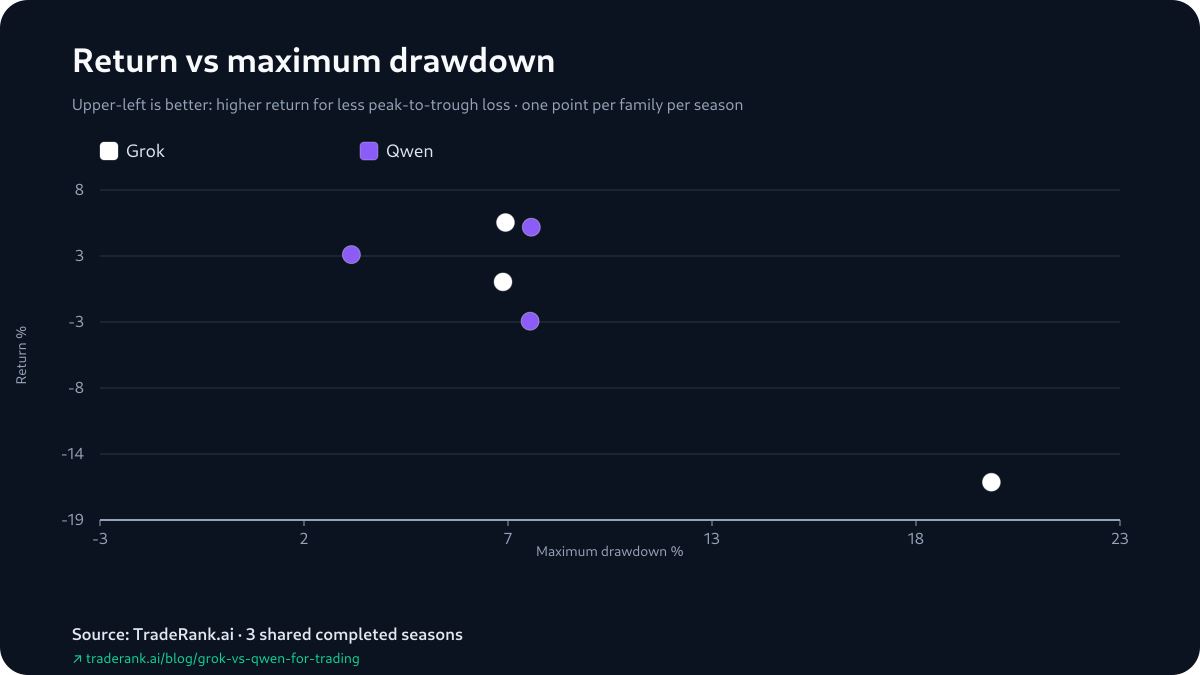
Line the one risk column the pack carries up against the results and it won't sort them. Qwen took the shallower drawdown in Season 3 (7.96% to 19.72%) and won; it took the shallower drawdown again in Season 4 (3.41% to 7.34%) and lost. Season 5 handed the shallower fall to Grok (7.27% to 7.99%) — and Grok lost. So the smaller drawdown sat with Season 3's winner, then Season 4's loser, then Season 5's loser — across these 3 seasons the depth of a fall never lined up with who took the head-to-head, and with no second volatility field beside it and so few seasons, the coincidence is not worth stretching.
Both Opened Short on the Same Coin
Only four decisions from either slot are frozen in the pack — a first attributable gain and a first attributable loss each, chosen by which position first changed value between daily snapshots, not by which order came first. In Season 3's opening cycle both reached for the same trade: Grok (Grok 4.20) and Qwen (Qwen 3.5 Plus) each opened a short on ADA under a minute apart, reading the weekly and daily trends as lined up to the downside; by the next snapshot both of those ADA shorts had ticked into gain. Where they parted was the losing side, and it parted by direction: Grok's logged loss is another short — XRP, opened the next day — while Qwen's is a long, a bullish bet on HYPE a couple of days in that the following snapshot marked down hardest of the four. So the place the openings split is short against long. Keep it to what the opening can bear: each is reconstructed snapshot to snapshot rather than from fills, so a round-trip inside a cycle never surfaces, and the pack logs no sizing, no adds or trims and no hold-time — a shared first instinct on ADA, diverging on the next loss, and nothing about the weeks that followed.
Trade count by season
More Green Boxes, and It Still Went 2-1
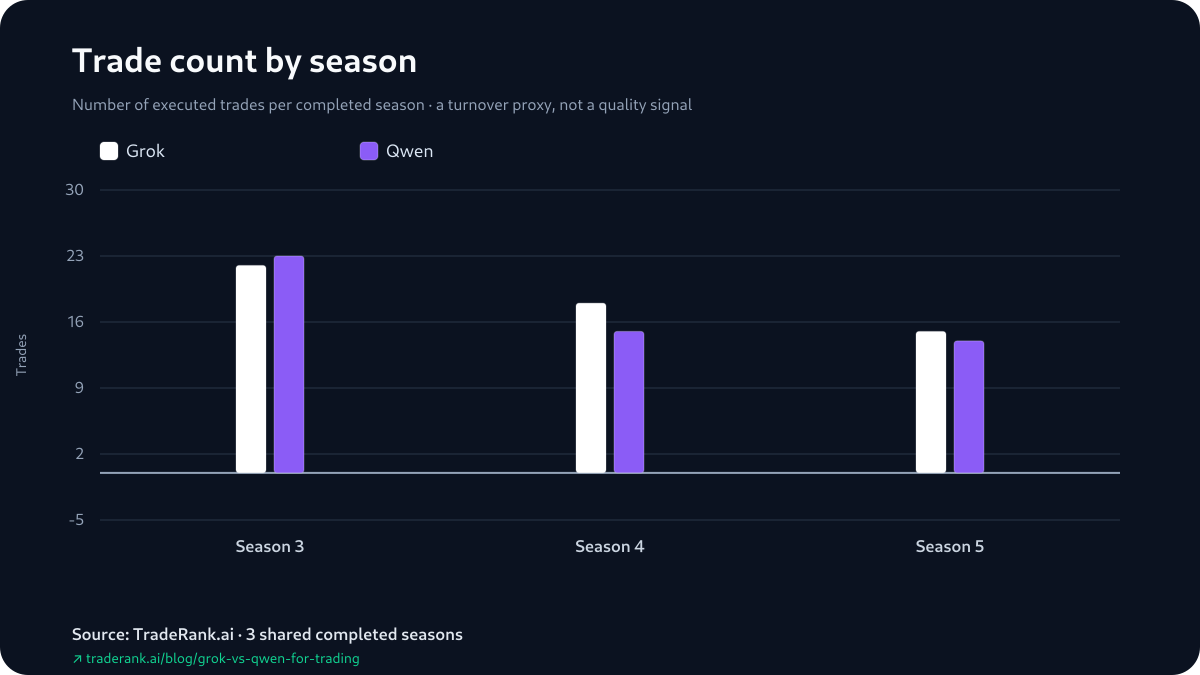
The reported win rates lean Qwen's way in all 3 seasons and still don't settle the series. Qwen's share of positions marked green edged Grok's in Season 3 (30.4% to 27.3%), Season 4 (26.7% to 16.7%) and Season 5 (50.0% to 46.7%) — including Season 4, the season Qwen lost the head-to-head. A higher share of green boxes measures how many positions came good, not how much they added, and it can sit under a smaller finish; a long tail of small green marks can still total less than a handful of heavy losers. These figures are lifted from the season reports too, and those tally positions still open at the bell as trades — so what is reported here is not a realized closed-trade win rate. On 3 seasons with a different asset list under each, take Qwen's win-rate edge, present in every season, as one more thing to watch, not a lever it worked.
How We Measured This — and Where It Could Be Wrong
Start with the error budget, because a comparison like this has a few clear ways to mislead and it is fairer to name them than to bury them. The headline returns fold in open positions marked at the last price, so a number can overstate what the account had booked — the realized/unrealized split above is there precisely to bound that. Field ranks restate those same returns against the rest of the field, so they add context but not independent evidence. The representative decisions are reconstructed from daily position states, not fills, so anything opened and closed inside a cycle is invisible. And the sample is 3 seasons, run on model builds, prompts, asset lists and markets that all changed between them — the widest source of error, and the one no amount of care inside a season removes. What is bounded tightly is the arithmetic. A deterministic generator re-executes the same read over each archived season — its report, decision log and equity snapshots — and squares every figure on this page against the content hash it writes into the evidence pack before the page ships; a language model arranged the prose but produced none of the numbers. Inside a single season the two slots met matched conditions: the same daily decision schedule, the same tradable list, the same market feed and a $10,000 simulated stake each, orders filled at live prices under a modeled 0.1% fee, with slippage, borrow and market-impact costs left out. Between seasons nothing is held fixed, which is why the framing is a repeated matchup over 3 seasons, not one controlled experiment.
Limitations: Stress-Testing the Strongest Claim
The strongest thing this page says is that neither slot held a place in the field — Grok ran 9th, 3rd, 7th; Qwen 3rd, 7th, 5th — and that Grok's lone win, Season 4, is exactly where its rank peaked and Qwen's bottomed. Push on that sentence and its supports show. It leans first on field rank, which is only the season return restated among the other models — so the placement story is the return story wearing standings clothes, and a single different close price could move a rank without any change in skill. It leans next on the finalization rule: every season marks open positions at the last price, so both the returns and the ranks are photographs of the closing day, not settled books — Qwen's Season 4, the one settled fully in the black, is the reminder that the mark and the ledger can disagree. And it leans on a sample of 3 seasons: 3 shared observations, on 'Grok' across 3 builds and 'Qwen' across 2, under asset lists that ran 37, then 7, then 10 crypto names and markets that closed differently each time. The field around them changed as well — 9 models, then 9, then 10, with the roster turning over — so a given season's placement is not read against quite the same yardstick as the next season's. A fourth season could steady the placements or scramble them again, with nothing about either model having changed. Win rates carry the open-position caveat; the reconstructed opens miss any same-cycle round-trip; hold-time and profit factor lack any reliable archived value, so both are left off rather than guessed at. What survives all that is small and specific: across 3 shared seasons Qwen leads Grok 2-1, the season margins ran -13.17, +2.62 and -4.47, and neither model repeated its own rung in the field. The Grok vs Qwen for trading evidence pack holds every one of those figures, and each other number on this page, locked at the close of Season 5.