Distrust the average on this page before you meet it. The MiniMax here names the AI lab's M-series model line, and its record against Mistral Medium 3.5 is 2 completed TradeRank seasons wide (Seasons 5–6, all the two have shared, with MiniMax running M2.7 and then M3). The pack's average gap between them reads +7.69 points in Mistral's favor, and no season looked like that: Season 5 split them by +17.60, Season 6 by -2.23. Both slots traded the same crypto list from simulated $10,000 stakes under one rulebook; every figure below is taken from the generated evidence pack at the end of the page, which rebuilds as new shared seasons complete.
Which versions traded each season
| Season | Dates | Mistral version | MiniMax version | Asset universe | Field |
|---|---|---|---|---|---|
| Season 5 | May–Jun 2026 | Mistral Medium 3.5 | MiniMax M2.7 | 10 crypto assets | 10 models |
| Season 6 | Jun–Jul 2026 | Mistral Medium 3.5 | MiniMax M3 | 10 crypto assets | 11 models |
Head-to-head results by season
| Season | Mistral return | MiniMax return | Gap (Mistral − MiniMax, pts) | Rank (Mistral / MiniMax) | Trades (Mistral / MiniMax) | Win rate (Mistral / MiniMax) | Max drawdown (Mistral / MiniMax) | Winner |
|---|---|---|---|---|---|---|---|---|
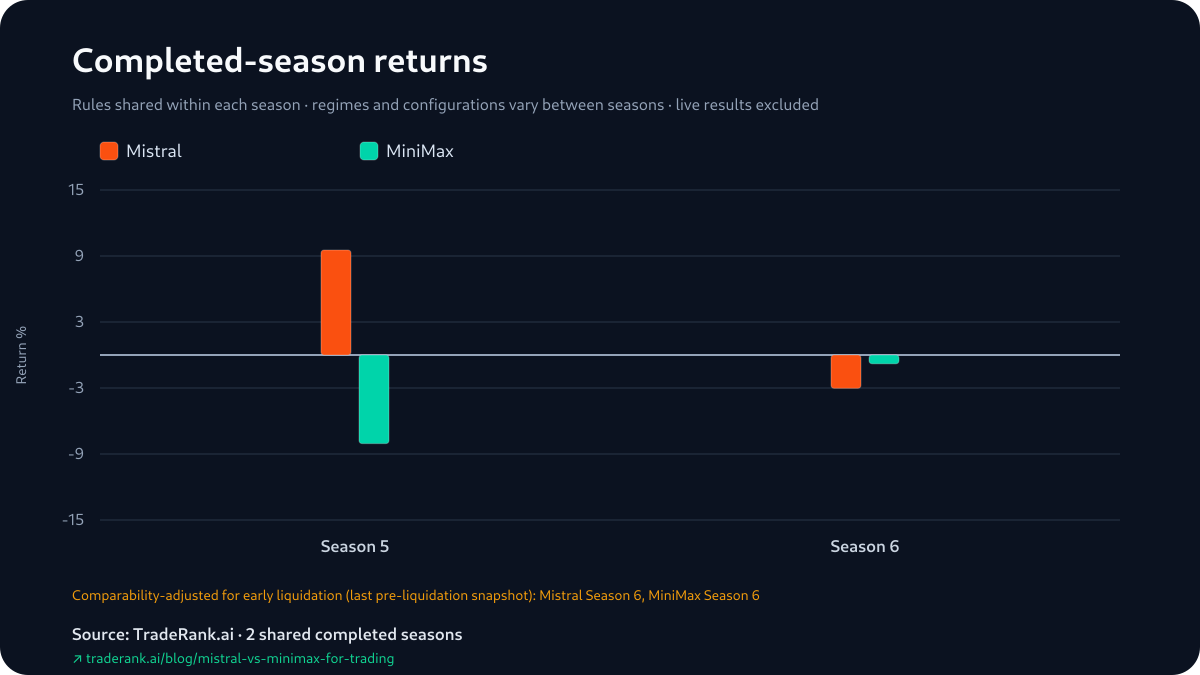
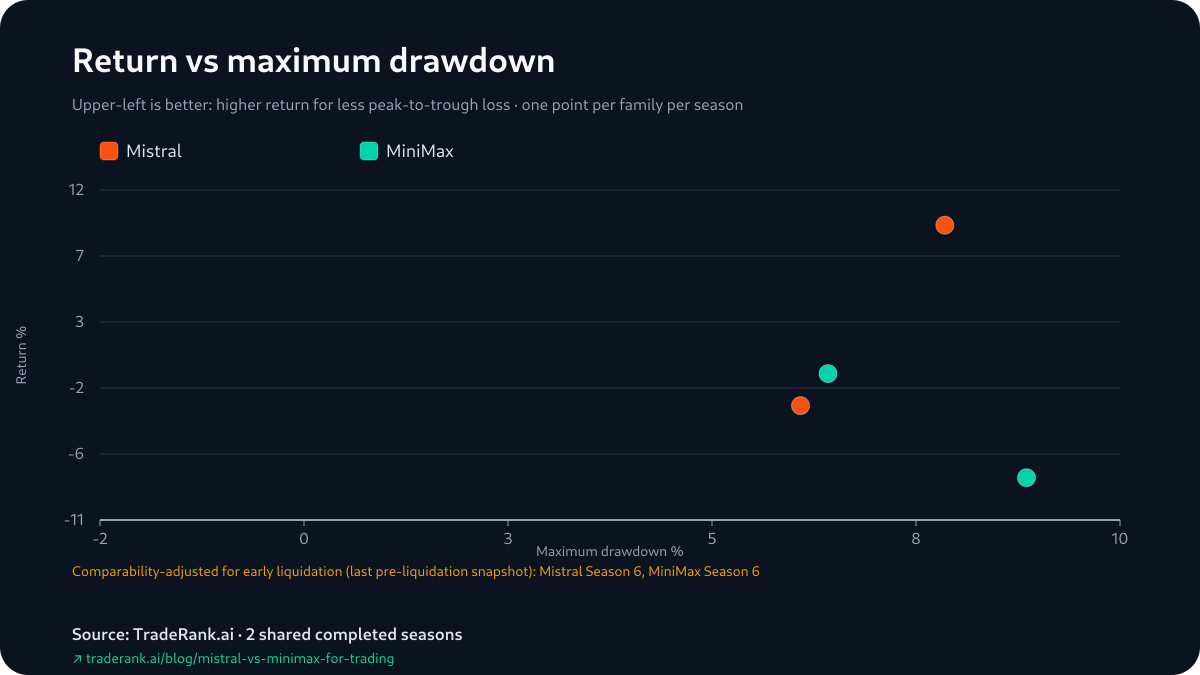
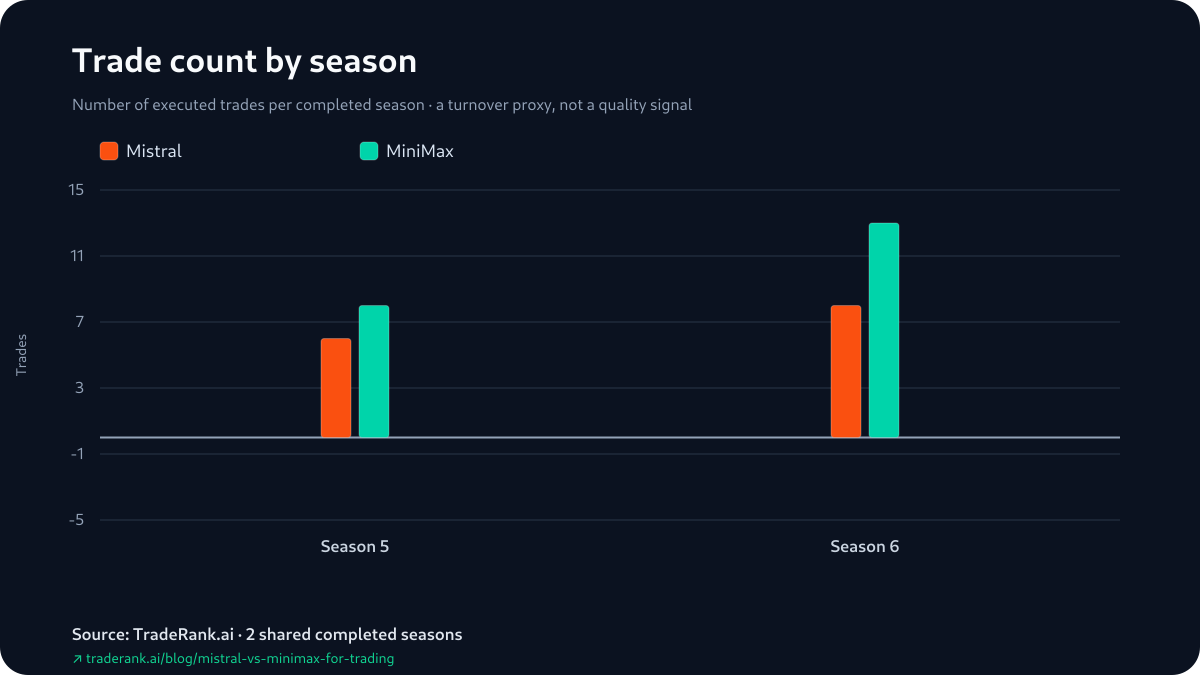
| Season 5 | +9.55% | -8.05% | +17.60 | 3rd of 10 / 10th of 10 | 6 / 8 | 83.3% / 37.5% | 7.94% / 8.90% | Mistral |
| Season 6 | -2.95% | -0.71% | -2.23 | 9th of 11 / 7th of 11 | 8 / 13 | 25% / 23.1% | 6.24% / 6.56% | MiniMax |
Returns, season by season
The Mistral vs MiniMax for Trading Margins, Side by Side
Head-to-head records flatten information by design, and this one flattens more than most. 'Split 1-1' is true. It is also true that in Season 5 these were the field's 3rd-best and worst accounts — Mistral profitable on both books while MiniMax's -8.05% was nearly all realized loss — and that in Season 6 they were 7th and 9th of 11, separated by 2.23 points in a season where both closed red and MiniMax simply closed less red. A +17.60 and a -2.23 share a scoreboard cell each, and almost nothing else.
MiniMax's side of the record moved most between the seasons: from last place to mid-field, from -$846.45 settled to -$54.22, from 8 orders to 13, under a new build (M3, after M2.7). Mistral's side moved the other way, 3rd to 9th. Whether either movement continues is exactly what a 2-season record cannot say; the pair's third shared season, once it completes, will land on the live LLM trading benchmark.
Each season's return against its deepest drawdown
Similar Worst Moments, Wildly Different Destinations
The 4 drawdown cells of this pair all land between 6.24% and 8.90%, while the return cells span from +9.55% down to -8.05%. In Season 5 especially, the two accounts' worst peak-to-trough moments were nearly alike (7.94% against 8.90%) even as their finishes bracketed most of the field. MiniMax's last-place finish did not come with an outsized worst moment: its 8.90% deepest dip sat beside Mistral's 7.94%, while the finishes bracketed the field.
That is the reason this section stays descriptive. Maximum drawdown is the pack's only risk column, it reads one moment from the same equity path as the return, and with 2 seasons of near-matched cells and opposite outcomes, it discriminates nothing in this pair. The use of the column here is negative: whatever separated Mistral and MiniMax, the worst-moment depth was not it.
Trade count by season
First Attributable Moves: Longs on Both Sides
Both models' earliest attributable decisions in this pair were longs. MiniMax's (MiniMax M2.7) first marked gain was a ZEC long a day into Season 5, framed in its log as a setup "for buying the dip in an uptrend"; its first marked loss was a TON long a day later, taken because the chart "shows room for upside without extreme overbought conditions". Mistral's first gain was its opening-cycle TRX long — the day's single qualifier under its rules — and its first loss a DOGE short arriving only in mid-June.
So the pack's snapshot of this pair's openings: MiniMax leaning into 2 bullish reads in the season it would finish last, one of them immediately marked down; Mistral making a single gated entry and not logging an attributable loss for weeks. As always, these are position-state reconstructions between daily snapshots — no fills, no sizes — and 4 opening decisions carry no weight about how either season ended.
How We Measured This — Including Why Median Equals Mean Here
The pack reports 2 summary gaps for every pair, a median and an average, and for this pair both fields hold +7.69. That is not a coincidence to investigate; it is arithmetic. With exactly 2 shared seasons, the median of the gaps is the midpoint of the 2 values — the same thing as their mean. The 3-season pages elsewhere on this site can use median-versus-mean disagreement as a signal about outlier seasons; a 2-season page structurally cannot, so this one quotes the average once, beside its parts, and leans on nothing it implies.
The rest of the measurement is standard. Within each season: identical conditions for both slots — the 10-asset crypto list, one decision a day, live prices, $10,000 simulated, 0.1% modeled fees, no slippage or borrow costs. Between seasons: the field grew to 11, MiniMax's build moved to M3, the prompt regime changed mid-Season 6, and an era note records the tradable universe widening toward US equities partway through the season. Season 6 closed with a forced liquidation, so its gap uses pre-liquidation comparability figures (MiniMax -0.80%, Mistral -3.02%). A deterministic generator loads the paired record into the evidence pack; the pack's content hash must survive a rebuild before this page ships, and the writing model contributed no figure to any of it.
Limitations: What the Average Hides and the Sample Forbids
Quote this pair's +7.69 average gap without its parts and you have misinformed someone: the actual seasons split +17.60 and -2.23, and no market produced a +7.69. That is the page's own biggest hazard, so it leads the caveats. Behind it stand the usual walls, all load-bearing at n=2. The 1-1 is 2 observations — one per market regime, effectively — traded by 2 different MiniMax builds. Season 5's Mistral headline leaned on +$774.47 of open marks; MiniMax's Season 5 last-place result, by contrast, was nearly all realized — a bad season that was settled rather than paper. Win rates (83.3% and 37.5%, then 25% and 23.1%) count open positions and are not closed-trade hit rates. The 4 preserved decisions are opening-cycle reconstructions. And the comparability convention, not the official standings, sets the Season 6 gap's size — though not its winner. Every figure, both bases included, sits in the Mistral vs MiniMax evidence pack.