Take the three windows first, then the scoreline. This DeepSeek vs MiniMax for trading page reads a closed archive, and a deliberately partial one: the 3 stable-roster seasons in which TradeRank's DeepSeek and MiniMax slots traded the same crypto under one rulebook. Season 3 ran 34 days over a 37 crypto assets universe with 9 models in the field; Season 4 ran 27 days across 7 assets, 9 models; Season 5 ran 28 days across 10 assets, 10 models. Across those 3 windows MiniMax finished ahead of DeepSeek 2-1. Names to pin down before the record means anything: MiniMax here is the MiniMax AI model family (its own company — not the minimax search algorithm), running M2.5 then M2.7, and DeepSeek runs V3.2 then V4 Pro; both are fast-moving families whose results shift between builds. TradeRank has more completed seasons than the 3 read here — this is the narrow, roster-matched view. No figure on this page was written by a model: every number is re-derived from a locked evidence pack, linked at the end.
The builds behind each season, and the field they traded
| Season | Dates | DeepSeek version | MiniMax version | Asset universe | Field |
|---|---|---|---|---|---|
| Season 3 | Mar–Apr 2026 | DeepSeek V3.2 | MiniMax M2.5 | 37 crypto assets | 9 models |
| Season 4 | Apr–May 2026 | DeepSeek V4 Pro | MiniMax M2.7 | 7 crypto assets | 9 models |
| Season 5 | May–Jun 2026 | DeepSeek V4 Pro | MiniMax M2.7 | 10 crypto assets | 10 models |
Head-to-head results by season
| Season | DeepSeek return | MiniMax return | Gap (DS−MM, pts) | Rank (DS / MM) | Trades (DS / MM) | Win rate (DS / MM) | Max drawdown (DS / MM) | Winner |
|---|---|---|---|---|---|---|---|---|
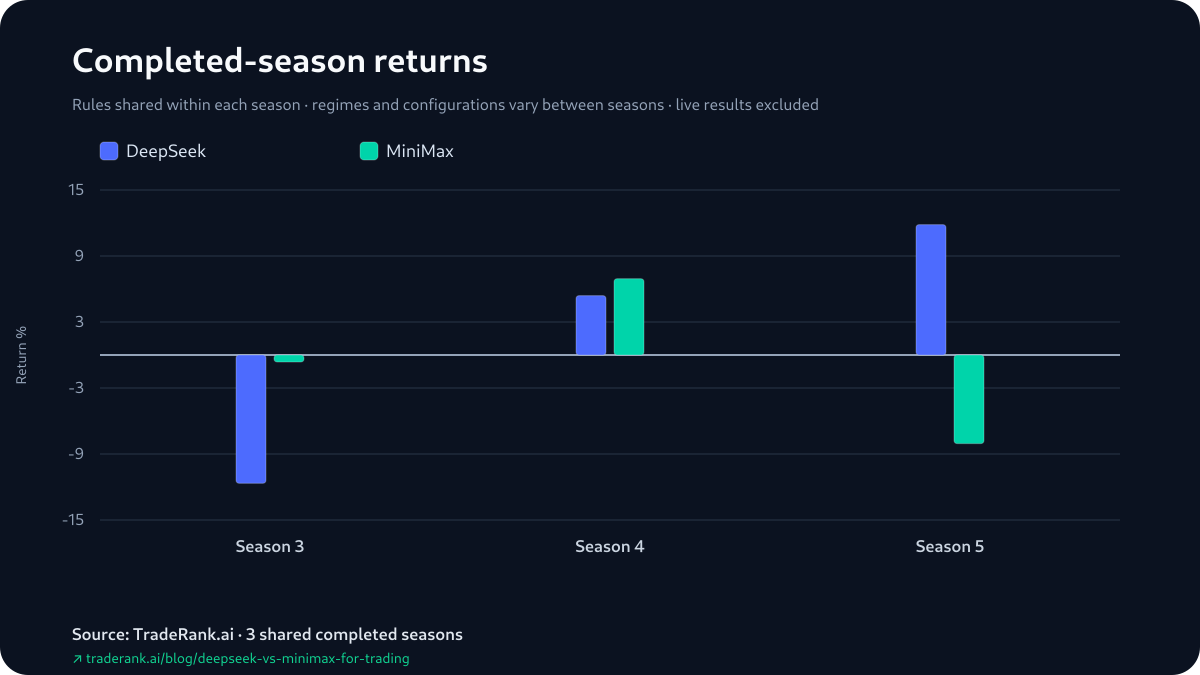
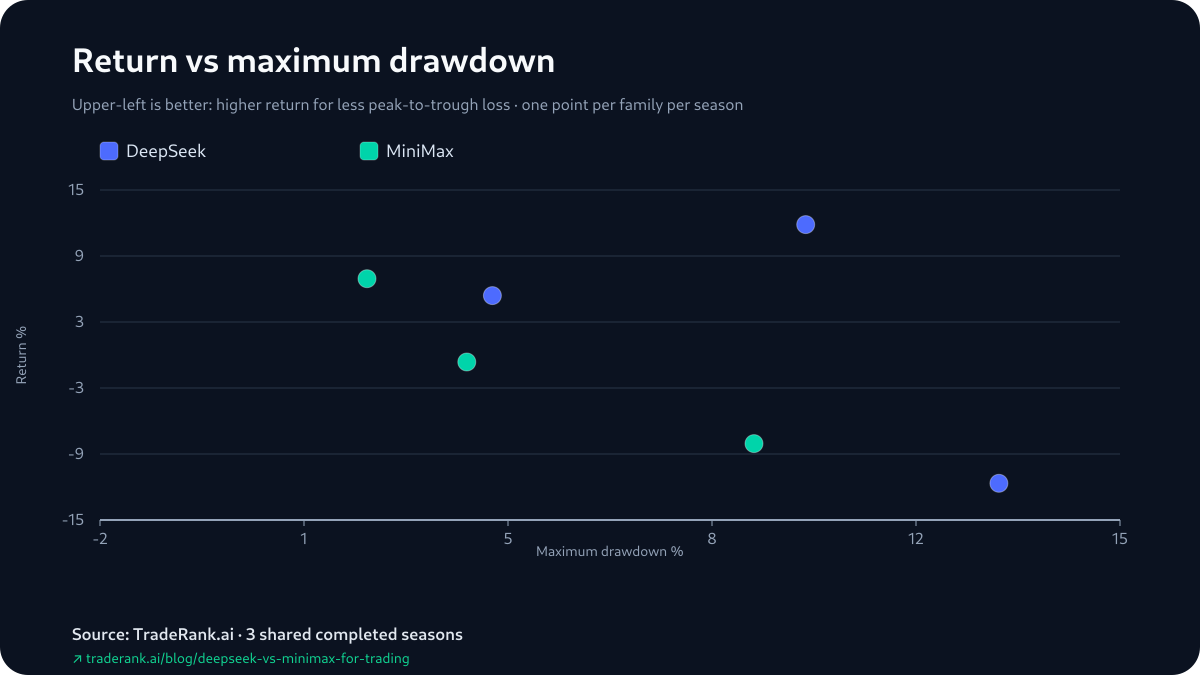
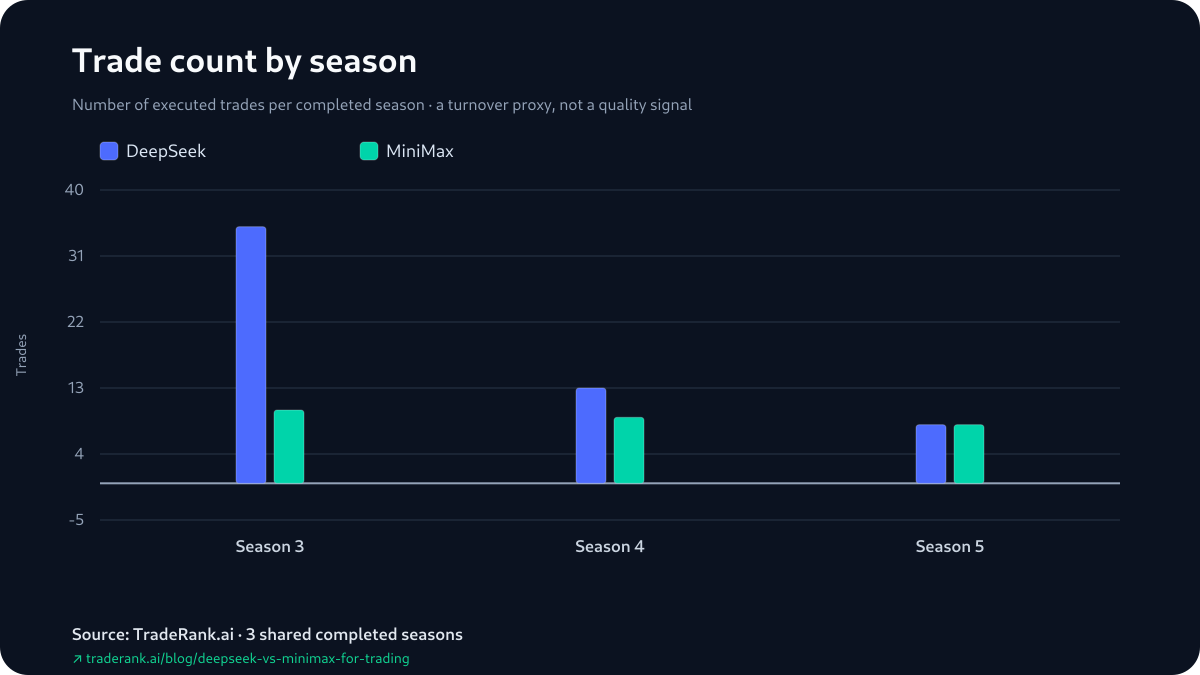
| Season 3 | -11.66% | -0.63% | -11.03 | 8th of 9 / 1st of 9 | 35 / 10 | 22.9% / 20.0% | 12.98% / 4.11% | MiniMax |
| Season 4 | +5.40% | +6.94% | -1.54 | 2nd of 9 / 1st of 9 | 13 / 9 | 30.8% / 55.6% | 4.54% / 2.45% | MiniMax |
| Season 5 | +11.85% | -8.05% | +19.90 | 2nd of 10 / 10th of 10 | 8 / 8 | 75.0% / 37.5% | 9.76% / 8.90% | DeepSeek |
Returns, season by season
DeepSeek vs MiniMax for Trading: 3 Seasons, Read in Order
Line the 3 seasons up and the two of them trace different shapes. DeepSeek's return climbed at each step — -11.66%, then +5.40%, then +11.85% — a strictly rising run across all 3. MiniMax's went the other way after a peak: -0.63%, up to +6.94%, then down to -8.05%. For the 2 seasons MiniMax stood higher, it won the head-to-head; when the paths crossed in Season 5, the result crossed with them.
On the running count, MiniMax led after Season 3, led by more after Season 4, and DeepSeek's Season 5 win closed the record to 2-1. At no point across these 3 seasons did DeepSeek hold the lead. The live LLM trading benchmark tracks where the two slots stand in the open competition; nothing on this page moves, because it is the finished archive behind that view. One caution the shapes invite and cannot support: 3 seasons is 3 observations, each under a different build and a different market, so a rising line and an inverted one are a sequence to describe, not a habit to project onto Season 6.
Where the Two Headline Returns Actually Settled
Season standings mark open positions at their last live price, so a headline return and a booked profit are separate readings — and the two most eye-catching numbers here fall on opposite sides of that line. MiniMax's Season 4 win, +6.94%, was positive on both books: a realized +$447.24 with +$246.69 of open marks on top, a +$693.93 total that had partly cleared by the close. DeepSeek's Season 5 +11.85%, the largest single return either model posted, had not: the account crossed the finish holding +$1,411.45 in open positions marked at live prices while its realized book read -$226.40, so the open component by itself was larger than the +$1,185.05 total. That does not undo the standing — the gain was part of the official simulated return, and DeepSeek won Season 5 — but it puts the run's biggest number on its least-settled footing.
MiniMax's own last season ran the mirror image. Its -8.05% in Season 5 was booked, not paper: a realized -$846.45 against just +$41.13 of open marks, for a -$805.32 total. Both accounts are play money on either side, so this is a note on where each number stood when the season closed, not a second scoreboard hiding behind the first.
Return against maximum drawdown
The Shallower Drawdown Belonged to the Model That Trailed the Return Race
The one risk figure the pack holds is maximum drawdown — the deepest peak-to-trough dip inside a season — and it lands on the model the return race left behind. MiniMax carried the shallower maximum drawdown in all 3 seasons: 4.11% against DeepSeek's 12.98% in Season 3, 2.45% to 4.54% in Season 4, and 8.90% to 9.76% in Season 5. It fell less at its worst moment every time, and still ended Season 5 in last place, 10th of 10, at -8.05%. No contradiction hides in that pairing: the drawdown grades the single worst stretch of the equity path, and a book can keep every dip shallow while drifting to the bottom of the field all the same. The streak itself proves little — each of the 3 seasons swapped in new builds, a new tradable list and a new market — and maximum drawdown is the pack's only risk column, with no volatility figure beside it.
Trade count by season
Both Ledgers Open on the Same Winning Trade
The pack keeps four opening decisions from Season 3 — the first move it can attribute to a gain, and the first it can attribute to a loss, for each side, reconstructed from how positions were marked between consecutive daily snapshots rather than from fills. The two gains are the same trade. On Season 3's opening day, within a few minutes of each other, DeepSeek and MiniMax each opened a short on ADA — both reading the weekly and daily trends as lined up to the downside — and each watched that ADA short mark up on the next snapshot. Their first losses parted: DeepSeek's landed on a UNI short opened the same day, MiniMax's on an ETH short opened 4 days later — both bets that the downtrend would hold, both marked down next snapshot.
Hold that to what an opening cycle can bear. 4 entries out of 3 whole seasons of activity explain none of the season-long gaps, and the pack logs no position sizes, no adds or trims, no hold times — only the entries and their next-day marks. What is visible is a shared opening instinct on the short side that the two agents priced the same way on the same coin, and a pair of first losses that came apart on different names and different days. It says nothing about the rest of either run.
The Higher Win Rate Lost the Opening Season
One pairing rewards over-reading, so take the plainest cell in it. In Season 3 the model with the higher reported win rate lost the head-to-head: DeepSeek marked 22.9% of its positions green to MiniMax's 20.0%, and MiniMax still finished 1st of 9 while DeepSeek finished 8th. The later seasons do not line up cleanly either — MiniMax's win rate ran well ahead in Season 4 (55.6% to 30.8%) in a season it won, then trailed in Season 5 (37.5% to DeepSeek's 75.0%) in a season it lost. Two things keep any of this from being a lever: these win rates are lifted straight from the season reports, which tally positions still open at the bell as trades, so a closed-only hit rate would read lower on both sides; and a larger share of green positions can still weigh less than a smaller share of larger ones. A win rate and a season return are answering different questions here, and on 3 seasons neither answer carries far.
How We Measured the Pair
Every season ran both models on the same rig. Within a given season, DeepSeek and MiniMax saw the same market data, started from the same $10,000 of simulated capital, traded the same asset list, and decided once a day under one rulebook; each then wrote its own thesis and placed its own orders. Orders filled at live market prices with a modeled 0.1% fee per trade; slippage, market impact, borrow costs and the risk of real money were left out. What no rig holds fixed is everything between seasons — the builds were upgraded, the tradable universe swung from 37 names down to 7 and back up to 10, and the market handed down its own verdict every time — which is why this reads as a repeated matchup, not one controlled experiment.
As for who did the arithmetic: a deterministic generator, not a language model. It reads every finished season's equity snapshots, decision log and report, outputs the head-to-head into an evidence pack fixed under a content hash, and this page is examined against that hash before it ships. A language model supplied the sentences between the values; the values themselves it could not alter, invent or re-derive — they arrive pre-fixed from the generator and ship as they arrived.
Limitations, and Why the Other Matchups Do Not Transfer Here
One caveat is specific to a page like this, so it goes first: a reader who has seen our other DeepSeek or MiniMax comparisons should not carry those verdicts into this one. Each pair is scored only against its own opponent, over the seasons the two happened to share — DeepSeek's record against a different model says nothing about how it stood against MiniMax, and MiniMax's shape against a different opponent is a separate set of paired outcomes. Borrowed confidence is the easiest error to make across a cluster of head-to-heads; this page earns none of it.
The measurement limits stack behind that. Returns fold in unrealized P&L, which is why the realized/open split is reported season by season — DeepSeek's Season 5 +11.85%, built on +$1,411.45 of unsettled marks above a realized -$226.40, is the live example. Win rates count still-open positions among the trades, so they read high against a closed-only rate. The four opening decisions are reconstructed from daily position states, not fills, so same-cycle round-trips are invisible and season-end opens are marks. Prompts, model builds, the asset universe and the market all moved between seasons, so 'DeepSeek' covers 2 builds here and so does 'MiniMax'; only the once-a-day cadence held. Maximum drawdown is the lone risk column, with no volatility figure beside it, and hold-time and profit factor have no reliable numbers in the archive, so the page leaves them out rather than guessing.
Where does that leave the pair? MiniMax holds the head-to-head 2-1, DeepSeek's return rose across all 3 seasons while MiniMax's peaked and dropped, and the two paths crossed exactly once, in Season 5. To audit any of it, open the DeepSeek vs MiniMax for trading evidence pack — it holds the 3 shared seasons in full, each build on both sides, and a scoreline that leans one way while the trajectory leans the other.