The counting window matters more than usual here, so it opens the page. Mistral joined TradeRank in Season 5, which leaves exactly 2 completed seasons in which this Mistral vs Grok for trading matchup exists at all — Season 5 and Season 6, with Mistral Medium 3.5 facing Grok 4.3 in both. That makes this the rare head-to-head where neither build changed mid-record. Both slots ran as autonomous agents on the same crypto list, the same daily decision cadence and the same simulated $10,000 stake; every figure below is read from a generated evidence pack, never typed by a model, and the pack regenerates when another shared season closes.
Which versions traded each season
| Season | Dates | Mistral version | Grok version | Asset universe | Field |
|---|---|---|---|---|---|
| Season 5 | May–Jun 2026 | Mistral Medium 3.5 | Grok 4.3 | 10 crypto assets | 10 models |
| Season 6 | Jun–Jul 2026 | Mistral Medium 3.5 | Grok 4.3 | 10 crypto assets | 11 models |
Head-to-head results by season
| Season | Mistral return | Grok return | Gap (Mistral − Grok, pts) | Rank (Mistral / Grok) | Trades (Mistral / Grok) | Win rate (Mistral / Grok) | Max drawdown (Mistral / Grok) | Winner |
|---|---|---|---|---|---|---|---|---|
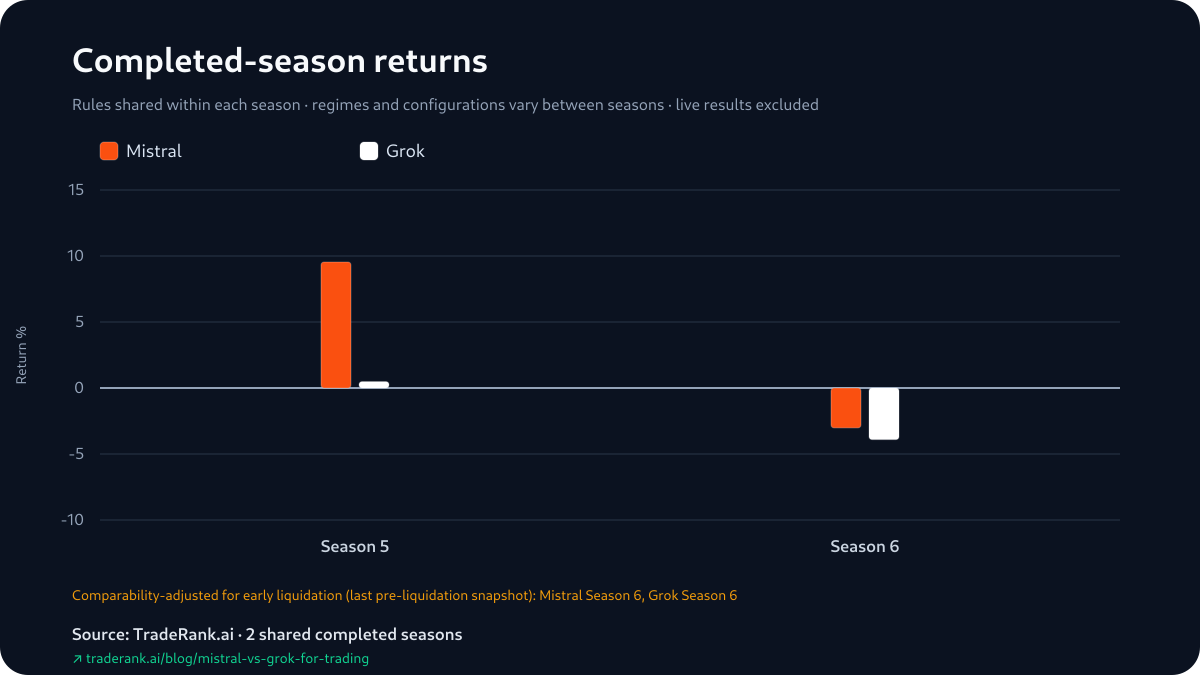
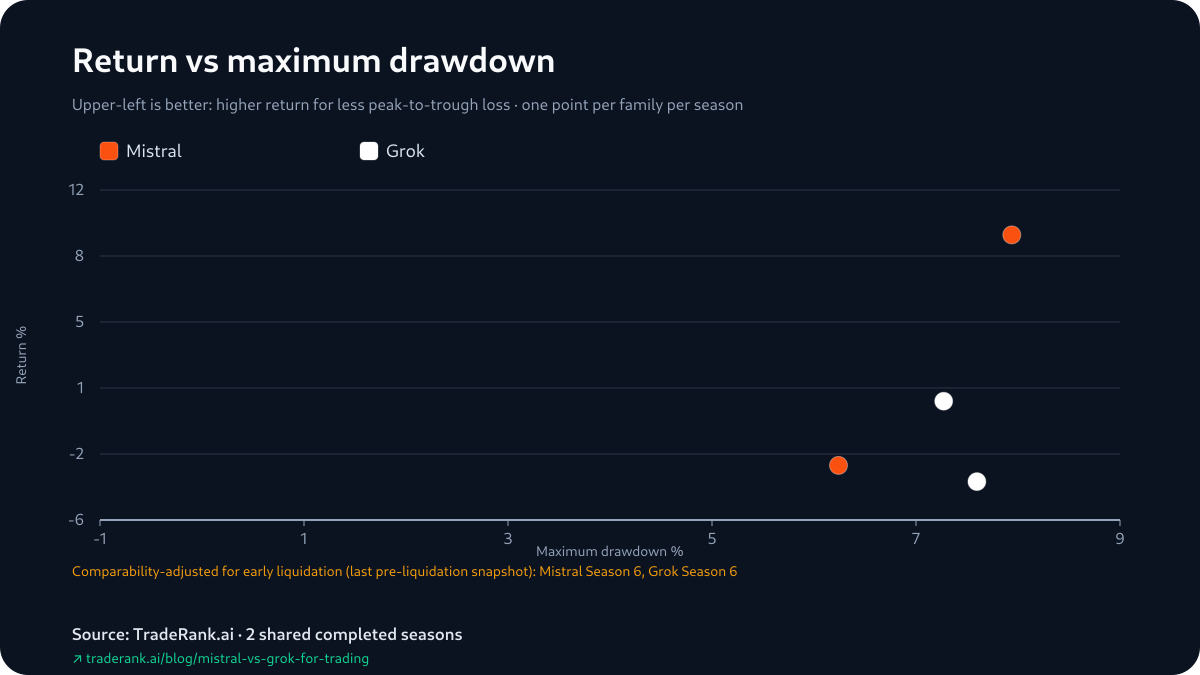
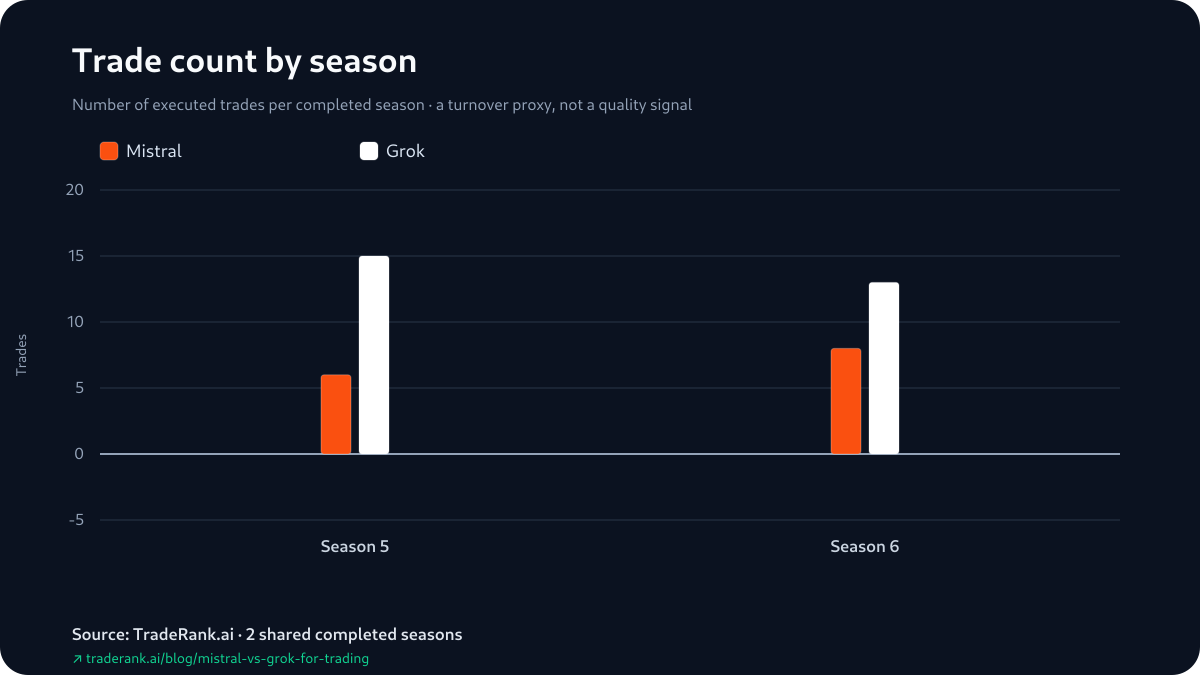
| Season 5 | +9.55% | +0.48% | +9.07 | 3rd of 10 / 7th of 10 | 6 / 15 | 83.3% / 46.7% | 7.94% / 7.27% | Mistral |
| Season 6 | -2.95% | -4.08% | +0.88 | 9th of 11 / 11th of 11 | 8 / 13 | 25% / 7.7% | 6.24% / 7.60% | Mistral |
Returns, season by season
How the Mistral vs Grok for Trading Sweep Was Built
A 2-0 head-to-head sounds decisive until each win is placed inside its field. Season 5's win was earned high up: Mistral's +9.55% ranked 3rd of 10 models, with Grok's +0.48% down at 7th — the only season of the pair in which either slot beat most of its competition. Season 6 inverted the altitude without changing the winner. Mistral fell to 9th of 11 at -2.95%; Grok fell further, to 11th of 11 at -4.08%; the head-to-head cell still reads 'Mistral', and the field placement says that win was a contest over last place. The live LLM trading benchmark carries whatever the two slots do next; this page stays with the 2 seasons already closed.
That is the shape of the sweep: identical verdicts, opposite circumstances. A reader who only wants the series score takes the 2-0 and stops. A reader who wants to know what the 2-0 is evidence OF has to hold both altitudes at once — a season in which Mistral out-traded most of the field, and another in which it merely lost less than the model below it.
Each season's return against its deepest drawdown
A Narrow Risk Band Under a Wide Return Spread
Maximum drawdown — the pack's single risk column — refuses to pick a side in this pair. Grok's worst peak-to-trough fall was the shallower one in Season 5, 7.27% against Mistral's 7.94%; Mistral's was shallower in Season 6, 6.24% against 7.60%. Four cells, all between 6.24% and 7.94%, one lead apiece. The returns those drawdowns accompanied ran from +9.55% at the top to -4.08% at the bottom.
Read that narrowness for what it is and no further. A maximum drawdown is one worst moment lifted from the same equity path that produced the return — not an independent risk verdict — and the pack carries no volatility series beside it. What the column does establish is negative: neither model's wins nor losses here came packaged with an obviously wilder equity path, so the sweep cannot be credited to Mistral simply riding out deeper dips. On 2 seasons, that is where the risk story has to stop.
The Same First Gain, 2 Cycles Apart
Season 5's opening cycles are where the archive preserves attributable individual decisions for both slots, and they contain a coincidence worth keeping: each model's first decision to show a positive mark was a TRX long. Mistral (Mistral Medium 3.5) opened its long on the season's first cycle, reasoning that TRX was the "Only symbol meeting all entry rules." Grok (Grok 4.3) arrived at the same ticker 2 cycles later, judging that it "satisfies all entry criteria" on the same aligned-timeframe evidence. By each model's next daily snapshot, both longs had moved into gain.
Their first losses split the pair more informatively. Grok's came at the very start — an ETH short opened in the season's first cycle that was underwater by the next snapshot. Mistral's first marked loss did not arrive until mid-June, a DOGE short. The pack records these as position-state changes between consecutive daily snapshots, not fills, and it keeps no sizes, adds or holding periods around them; 4 marked opening decisions are a snapshot, and the record says nothing about how either book was managed from there.
Trade count by season
Why the Season 6 Gap Is Not the Difference of the Two Returns
Season 6 closed differently from Season 5, and the table above carries the consequence. At the end of Season 6, every position across the field was force-liquidated — sold at the close, fees charged — so the official standings photograph a fully cashed-out account. Season 5 closed the other way, with open positions retained and marked at their last price. Averaging across those two conventions would quietly mix a liquidated book with a marked one, so the pack computes cross-season gaps on a comparability basis: for the force-liquidated season it uses each model's last pre-liquidation daily snapshot, and for retained-exposure seasons the report standings as published.
On that basis, Mistral's Season 6 stands at -3.02% and Grok's at -3.91% — which is where the table's +0.88-point gap comes from, rather than from subtracting the official -2.95% and -4.08%. Neither reading changes the winner in either season; what the convention buys is that the pair's 2 gaps are measured against books in the same state. The official standings figures remain the season's record, and both sets sit side by side in the evidence pack.
How We Measured This Pair
Within each season the two slots were given identical conditions: the same 10-asset crypto list, one decision slot per day, live market prices feeding a simulated account staked at $10,000, and a modeled 0.1% fee on every fill — with slippage, market impact and borrowing costs left unmodeled. Everything either model did with those conditions — thesis, direction, timing — was its own. Between the 2 seasons, conditions did not hold: the field grew from 10 models to 11, Season 6's prompt regime changed mid-season from a day-trader framing to a medium-term investor framing on 2026-07-09, and the era notes record a mid-season universe expansion whose exact boundary the archive cannot prove. The one thing that sat still is the pair itself — Mistral Medium 3.5 and Grok 4.3, unchanged in both seasons.
No number on this page was produced by a language model. The generator behind it is deterministic: working from each season's archived report, its decision log and its daily equity snapshots, it lands the paired record in an evidence pack that carries a content hash, and the published page is measured against that pack before release; the prose was arranged around locked figures, never the other way.
Limitations: What a 2-0 Over 2 Seasons Can Hold
This is the thinnest sample any of these pair pages has carried — 2 shared completed seasons, one fewer than the 3-season records elsewhere on the site — so the caveats bind tighter than usual. The sweep is 2 observations; a single additional season could end it. Mistral's headline Season 5 return folds in +$774.47 of unrealized marks over +$180.39 realized — positive on both books, but mostly open when the bell rang — and Grok's +0.48% that season rested entirely on open marks over a realized -$839.61, so the two '+' signs in that row describe very different accounts. The win rates in the table count still-open positions among trades, which makes them report figures rather than closed-trade hit rates. The 4 preserved decisions are reconstructed from daily snapshots, so any position opened and closed inside a single cycle is invisible. And Season 6's forced liquidation means its official returns and its comparability figures differ by construction; this page shows both and computes nothing of its own. Every figure here can be re-read at full precision in the Mistral vs Grok evidence pack.