To be clear about the names first: this Mistral vs Gemini for trading page compares Mistral AI's trading slot with the Gemini AI model line from Google — not the crypto exchange that shares the name. The record it settles is short and one-sided: Seasons 5–6, the only 2 completed TradeRank seasons both slots entered (Mistral joined in Season 5), with Gemini 3.5 Flash ahead in both. Mistral Medium 3.5 and Gemini 3.5 Flash each ran unchanged across the record, trading the same crypto list from the same simulated $10,000 under one rulebook; every figure on the page is copied out of a generated evidence pack linked at the end, and the pack rebuilds when the next shared season closes.
Which versions traded each season
| Season | Dates | Mistral version | Gemini version | Asset universe | Field |
|---|---|---|---|---|---|
| Season 5 | May–Jun 2026 | Mistral Medium 3.5 | Gemini 3.5 Flash | 10 crypto assets | 10 models |
| Season 6 | Jun–Jul 2026 | Mistral Medium 3.5 | Gemini 3.5 Flash | 10 crypto assets | 11 models |
Head-to-head results by season
| Season | Mistral return | Gemini return | Gap (Mistral − Gemini, pts) | Rank (Mistral / Gemini) | Trades (Mistral / Gemini) | Win rate (Mistral / Gemini) | Max drawdown (Mistral / Gemini) | Winner |
|---|---|---|---|---|---|---|---|---|
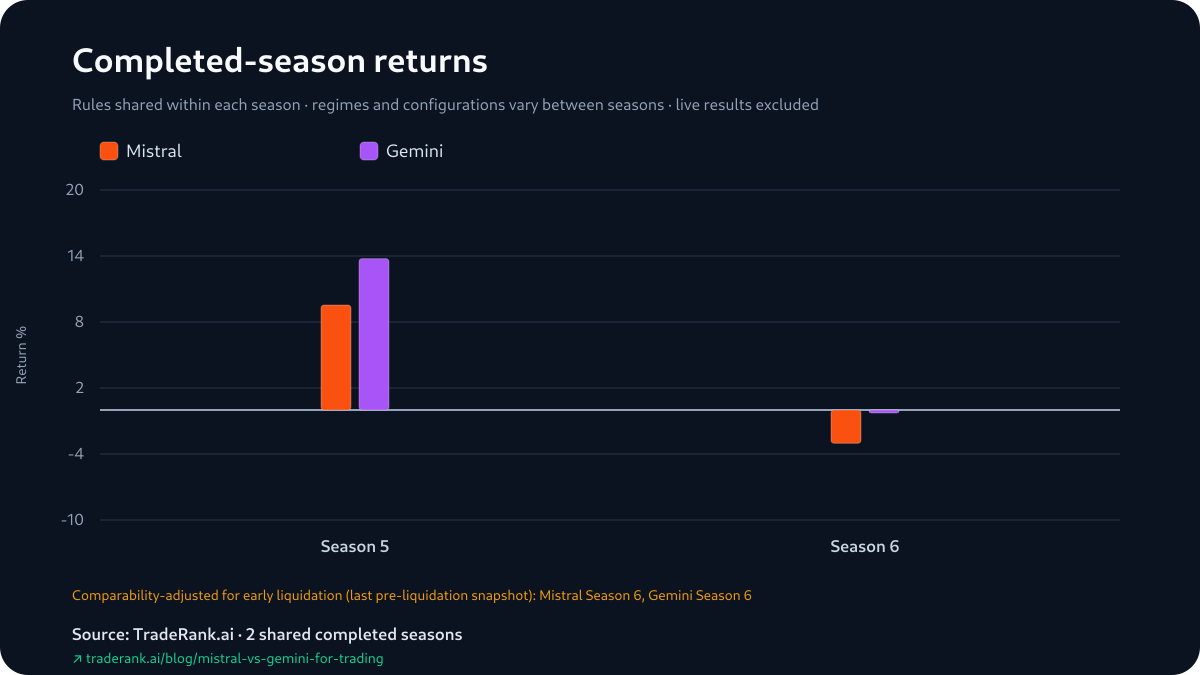
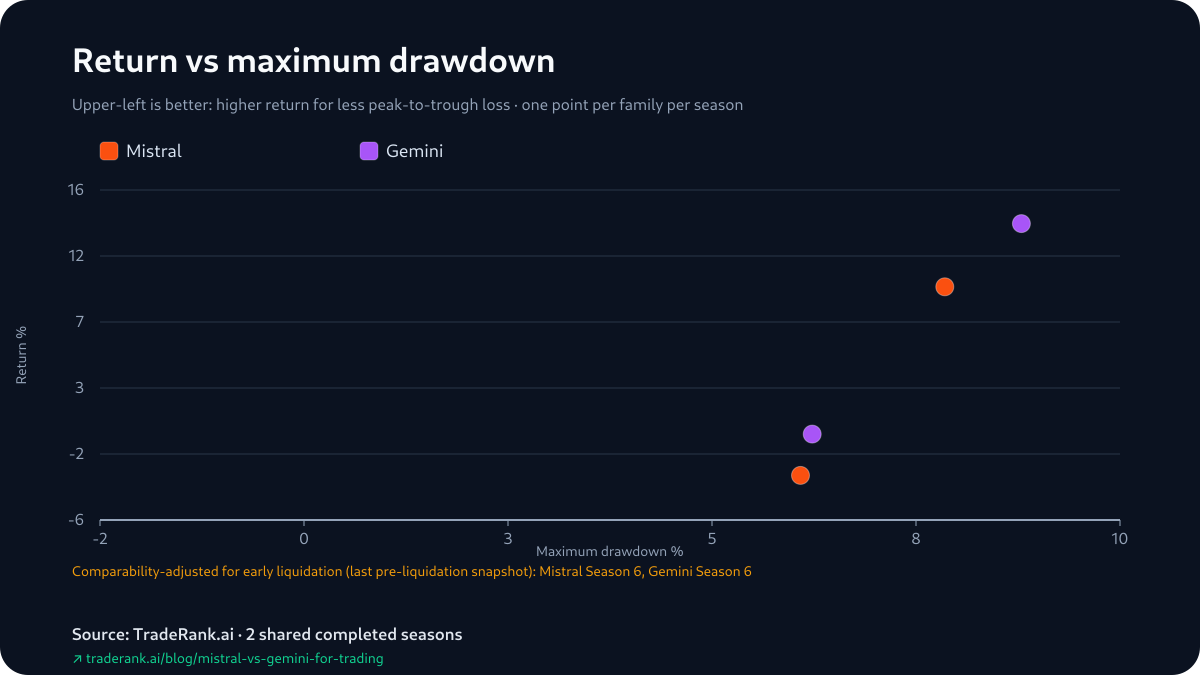
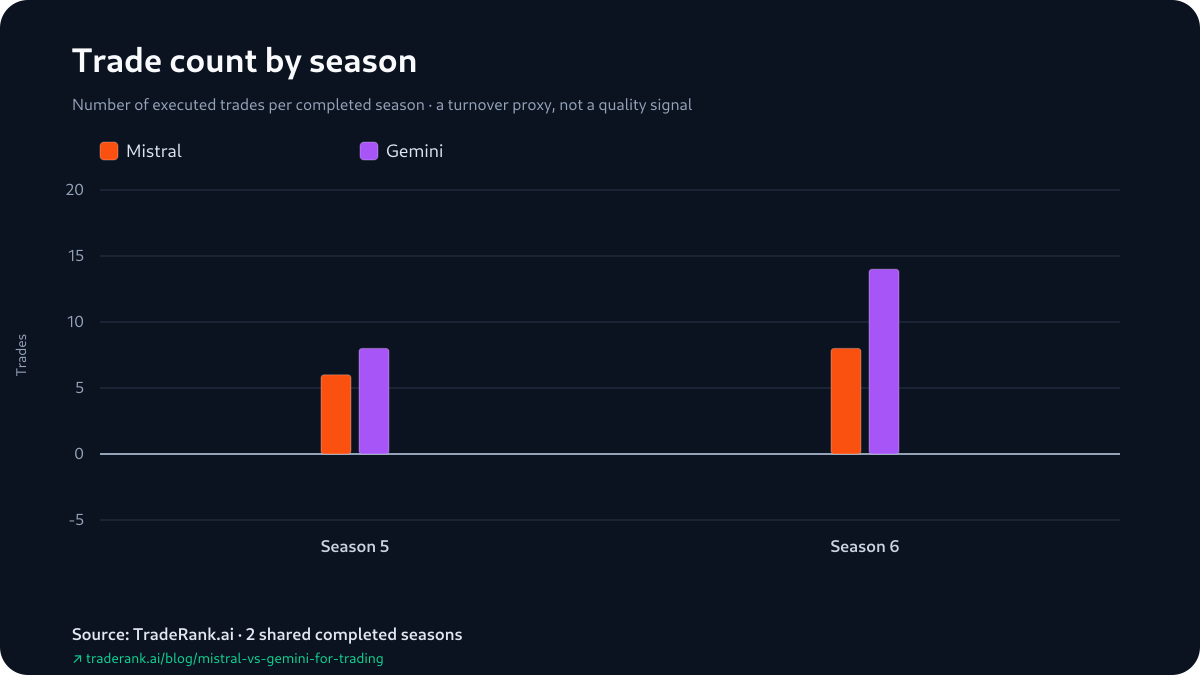
| Season 5 | +9.55% | +13.76% | -4.21 | 3rd of 10 / 1st of 10 | 6 / 8 | 83.3% / 62.5% | 7.94% / 8.84% | Gemini |
| Season 6 | -2.95% | -0.35% | -2.75 | 9th of 11 / 6th of 11 | 8 / 14 | 25% / 28.6% | 6.24% / 6.38% | Gemini |
Returns, season by season
How the Mistral vs Gemini for Trading Sweep Reads
Sweeps in this benchmark usually invite one question: did the winner beat a strong opponent or a weak one? This one answers both ways. Season 5's Mistral was not weak by any local measure — its +9.55% ranked 3rd of 10, its 83.3% win rate led the pair, and its book was profitable on realized and unrealized cash alike. Gemini beat that version of Mistral by finding 4.21 more points and the top of the field. Season 6's Mistral was the other kind of opponent, a 9th-place book down -2.95% — and Gemini beat that version too, though its own -0.35% would have won nothing in a stronger season.
The rank pairs — 3rd against 1st, then 9th against 6th — restate the same returns against the whole field, not a second scoreboard. What they add is context for the sweep's shape: Gemini finished above Mistral from the field's top and from its middle, in a green market and a red one. Two results, the same sign both times, produced under conditions different enough that the sign is the only thing they share.
Each season's return against its deepest drawdown
The Winner Also Took the Slightly Deeper Dips
For readers who use drawdown as a tiebreaker, this pair withholds the usual comfort. Gemini's maximum drawdown ran deeper than Mistral's in both seasons — 8.84% against 7.94%, then 6.38% against 6.24% — and Gemini won both seasons anyway. The 4 cells all sit between 6.24% and 8.84%, a much narrower band than the one the returns span.
As always, the ceiling on this column is low. A maximum drawdown is one moment on the same equity curve the return summarizes, there is no volatility field in the pack to widen the picture, and 2 seasons of near-tied cells support exactly nothing beyond the description just given. What can be said is narrow: on this record, the shallower-dip account was never the winning account.
A First Gain That Took Until Season 6
The archive's attributable decisions add an oddity to Gemini's side of this record. Mistral's earliest marked moves both sit in Season 5, the usual place — a TRX long from the opening cycle, taken when nothing else cleared its entry rules that day and marked up by the next snapshot, and a DOGE short in mid-June marked down. Gemini's first attributable loss is also a Season 5 opening-cycle trade, a DOGE short its log expected to "capture rapid downside momentum as market-wide capitulation continues" — but its first attributable gain does not appear until Season 6's opening day: an XRP short chosen because the chart looked "less extended than other candidates, giving more runway for the trend".
That asymmetry is a fact about attribution, not about performance — Season 5 obviously contained profitable Gemini positions, since the account finished 1st with +$1,439.66 of open gains, but a gain must show up as a position-state change between consecutive daily snapshots to be individually attributable, and Gemini's Season 5 gains were not. It is a clean illustration of what this decision record is: a reconstruction with strict rules and gaps, not a trade blotter.
Trade count by season
How We Measured This, and What the Figures Are Denominated In
Denominate the figures before trusting them: each return on this page is a percentage of a simulated $10,000 season stake, marked at that season's close — which for Season 5 meant marking open positions at their last price, and for Season 6 meant a forced liquidation of every position, fees included. Because those are different closing conventions, the pack computes the pair's gaps on a comparability basis: Season 6 uses each model's final pre-liquidation snapshot (Mistral -3.02%, Gemini -0.27%), Season 5 uses the standings as published. The table's return columns always show the official numbers; the -2.75 gap is the comparability reading, and the winner is unaffected on either basis.
Within a season nothing distinguished the slots' conditions: the same 10-asset menu, one decision per day, the same price feed, a modeled 0.1% fee, and no charges for slippage or borrowing. Between the seasons, the field grew from 10 models to 11, the prompt regime changed mid-Season 6 to a medium-term investor framing, and an era note logs the tradable list widening toward US equities partway through, at a moment the archive leaves unfixed. The numbers travel a fixed path: a deterministic generator records the paired record into the evidence pack under a content hash, and the built page is judged against that pack — a language model arranged these sentences and was never the source of a figure.
Limitations: The Sweep From Mistral's Side
Steelman the losing side and the sweep narrows without breaking. Mistral's Season 5 was, by this benchmark's own numbers, excellent — profitable on both books, 3rd in its field, the pair's higher win rate at 83.3% (a report figure that counts open positions, as all win rates here do). It lost to a +13.76% that was itself almost entirely unrealized: Gemini's 1st-place book had settled -$63.57 when the season closed. On banked cash that season, Mistral's +$180.39 was the pair's only positive figure. None of that changes a single standings cell — returns are the scoreboard, and Gemini won both seasons on it — but it marks how much of this 2-0 rests on end-of-season marks rather than settled results. Add the structural caveats — 2 observations, a prompt regime that changed mid-record, a season closed by liquidation and a season not — and the sweep reads as what it is: a consistent sign across 2 very different seasons, awaiting a third. The next one accrues on the live LLM trading benchmark, and every figure above sits in the Mistral vs Gemini evidence pack.