Read the returns chart below before the two names settle into a story. Across the 3 shared seasons it draws one shape twice and its mirror once: the MiniMax AI model edges ahead by a little in 2 seasons, then Gemini AI by Google clears the whole field by a wide margin in the third. This Gemini vs MiniMax for trading comparison closes the book on Seasons 3–5 — the 3 completed TradeRank seasons both slots were entered in — with Gemini trading as Gemini 3.1 Pro then Gemini 3.5 Flash, MiniMax as MiniMax M2.5 then M2.7, both running as autonomous agents on the same crypto under one rulebook off an identical simulated stake. No figure on this page was typed in or written by a model: each one is read out of the evidence pack, and the pack itself is regenerated whenever another season closes.
Which versions traded each season
| Season | Dates | Gemini version | MiniMax version | Asset universe | Field |
|---|---|---|---|---|---|
| Season 3 | Mar–Apr 2026 | Gemini 3.1 Pro | MiniMax M2.5 | 37 crypto assets | 9 models |
| Season 4 | Apr–May 2026 | Gemini 3.1 Pro | MiniMax M2.7 | 7 crypto assets | 9 models |
| Season 5 | May–Jun 2026 | Gemini 3.5 Flash | MiniMax M2.7 | 10 crypto assets | 10 models |
Head-to-head results by season
| Season | Gemini return | MiniMax return | Gap (Gemini − MiniMax, pts) | Rank (Gemini / MiniMax) | Trades (Gemini / MiniMax) | Win rate (Gemini / MiniMax) | Max drawdown (Gemini / MiniMax) | Winner |
|---|---|---|---|---|---|---|---|---|
| Season 3 | -2.64% | -0.63% | -2.00 | 2nd of 9 / 1st of 9 | 22 / 10 | 31.8% / 20% | 7.04% / 4.11% | MiniMax |
| Season 4 | +4.43% | +6.94% | -2.51 | 4th of 9 / 1st of 9 | 17 / 9 | 35.3% / 55.6% | 4.46% / 2.45% | MiniMax |
| Season 5 | +13.76% | -8.05% | +21.81 | 1st of 10 / 10th of 10 | 8 / 8 | 62.5% / 37.5% | 8.84% / 8.90% | Gemini |
Returns, season by season
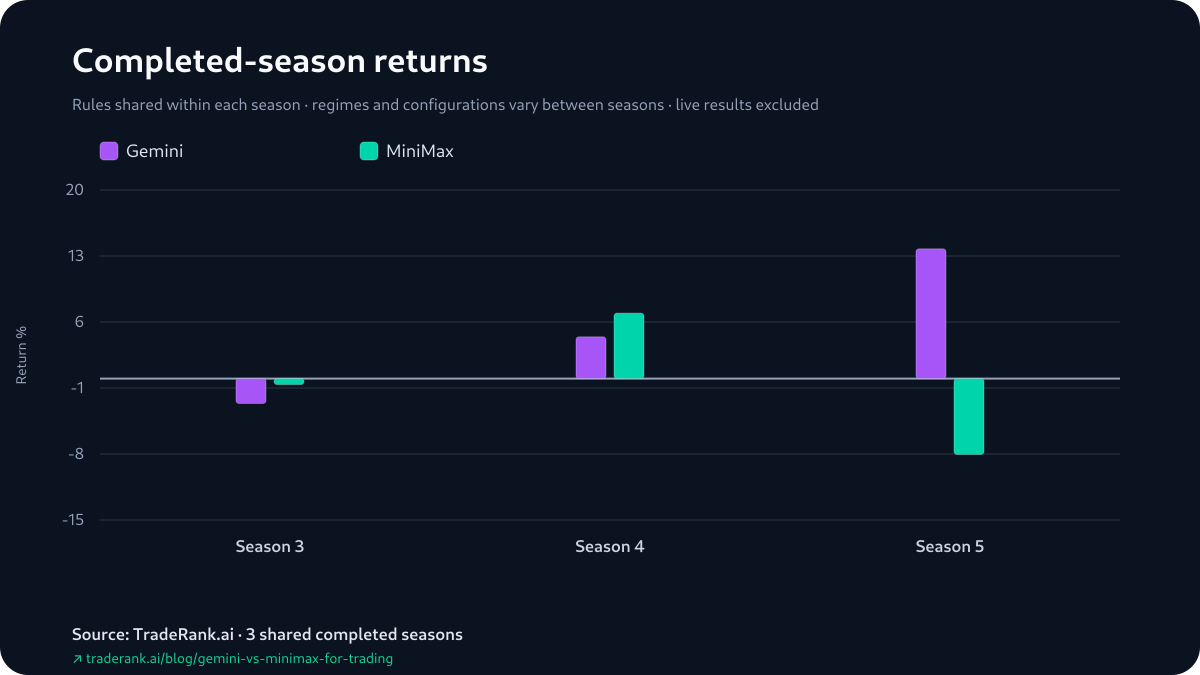
How the Gemini vs MiniMax for Trading Record Splits
Where the pair stands today is a different, live question — the live LLM trading benchmark follows that, while the record on this page is closed. Rank the 3 shared seasons by finishing margin and they split into two small gaps and a wide one. MiniMax took the small pair: -0.63% to Gemini's -2.64% in Season 3 (a -2.00-point gap, both underwater), and +6.94% to +4.43% in Season 4 (-2.51). Then Season 5 broke the other way and broke it hard — Gemini at +13.76%, MiniMax at -8.05%, a +21.81-point gap that is the widest of the run by a distance. So the 2-1 that looks like a MiniMax series win is 2 narrow seasons plus one wide result the other way.
The field ranks fall in the same order, and it pays to say plainly why that is not a separate reading. TradeRank orders the entire field by return, so a model's placement and its head-to-head result are a single fact wearing two labels: MiniMax ran 1st of 9 in Season 3 and 1st of 9 again in Season 4, with Gemini 2nd then 4th, before Season 5 flipped the extremes — Gemini 1st of 10, MiniMax 10th of 10. What the ranks add is scale — how high or low in the field each result landed — not a fresh vote on who beat whom. Hence the two summary figures from the top of the page — the -2.00 median and the +5.77 mean — landing on opposite sides of zero, with Season 5 the reason.
Each Season's Return and Its Deepest Drawdown
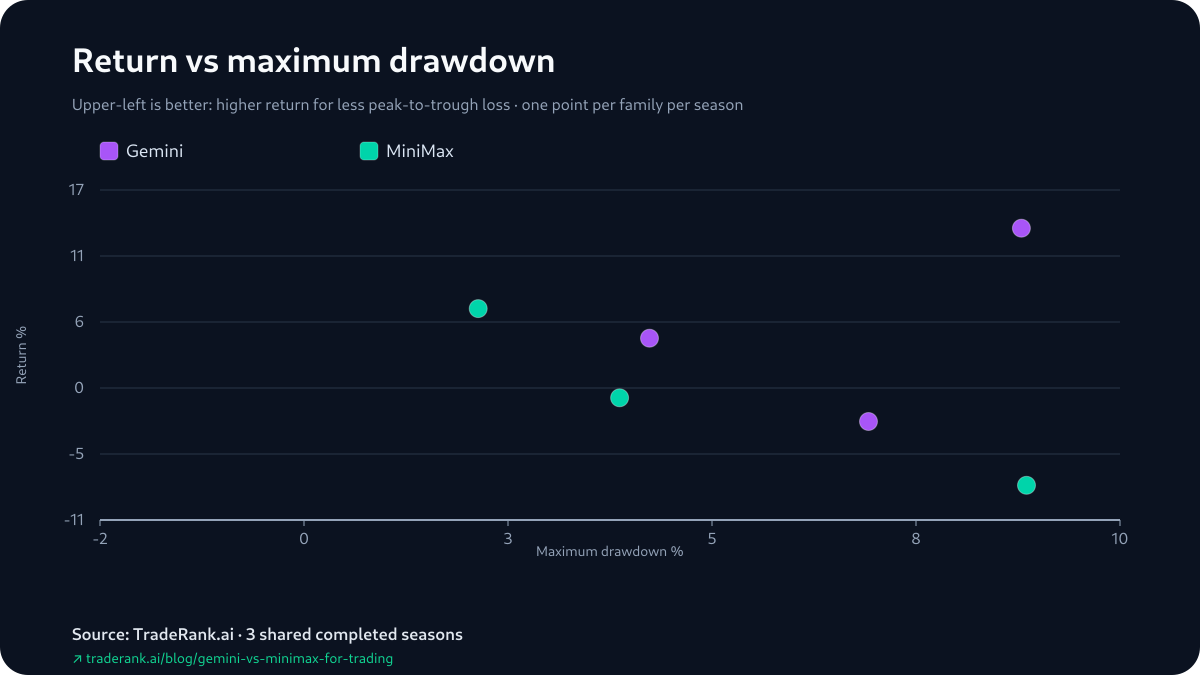
The Season They Matched on Risk Split Widest on Return
Maximum drawdown is the pack's lone risk column, and for 2 of the 3 seasons it lines up with the wins: MiniMax's deepest peak-to-trough fall came in under Gemini's in Season 3 (4.11% to 7.04%) and Season 4 (2.45% to 4.46%). Season 5 is where the column stops separating them — 8.84% for Gemini, 8.90% for MiniMax, all but identical. That is the season worth staring at, because the two columns the pack logs on how they traded — order count and worst-case drawdown — line up, and the outcome does not. They placed the same number of orders, 8 apiece; they rode almost the same worst-case drawdown; and they finished at opposite ends of a 10-model field, Gemini 1st at +13.76% and MiniMax 10th at -8.05%. Matched activity and matched risk across 2 separate accounts, and a +21.81-point gap between the results.
Hold that observation to its actual width. Maximum drawdown is a single worst-moment figure drawn from the same equity path as the return, not a second, independent verdict stacked beside it, and the pack logs nothing on volatility to set alongside it. Similar deepest dips in 2 accounts say the dips were similar — nothing about why one ended the season best in the field and the other last. And the claim covers those two columns only, checkable season by season: order counts of 22 to 10, then 17 to 9, then 8 to 8; drawdowns of 7.04% against 4.11%, then 4.46% against 2.45%, then 8.84% against 8.90%. On both columns Season 5 is the closest of the 3 — and it is the season with the widest gap in results.
What the Opening Cycle Preserved
Season 3 is the only window the archive opens onto individual decisions, so treat it as a snapshot and nothing larger. For each model the pack pins down its earliest gain and its earliest loss that can be attributed to a position, and laid next to each other they describe a single trade idea with two authors. In that first cycle Gemini (Gemini 3.1 Pro) sold BNB and ARB short; MiniMax (MiniMax M2.5) sold ADA short in the same cycle, with an ETH short following a few cycles later. Both leaned on the same evidence — a 70/100 bearish composite, the weekly through 4-hour reads aligned to the downside — and for both it cut in opposite directions inside the pair: by the next snapshot one leg of each had moved into profit and the other into loss, settled by which ticker moved rather than by anything separating the two calls.
The ceiling on that is low. 4 marked decisions, 2 a side, out of the opening cycles cannot describe how a season played out, and the pack keeps no position sizes, no adds or trims, and no holding periods to fill in around them. The durable point is thin but genuine: two slots reached for the same short thesis in the same window, and the record goes quiet after that.
Trade count by season
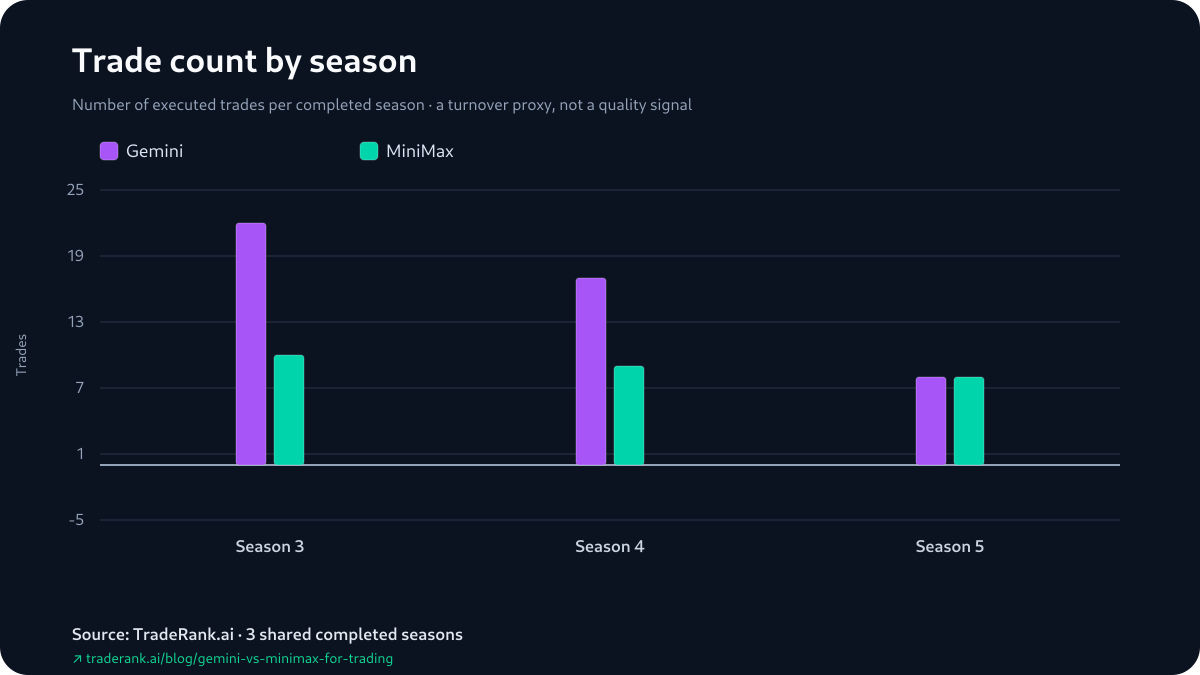
The Win Rate and the Finish Came Apart in Season 3
Season 3 puts a cell on the table where the reported win rate and the season finish disagree. MiniMax's win rate that season was the lower of the two, 20% to Gemini's 31.8% — yet MiniMax returned more, -0.63% to Gemini's -2.64%, and placed 1st of 9 to Gemini's 2nd. Lower hit rate, higher finish: the count of winning positions did not set the order that season; the account level did. The other 2 seasons line up the ordinary way — in Season 4 MiniMax paired the higher rate, 55.6% to 35.3%, with the win, and in Season 5 Gemini paired 62.5% to 37.5% with its win — so across the 3 seasons the higher reported win rate sat with the season's winner twice and against it once. And treat those rates as reported, not audited: the standings count any position still open at the close as a trade, which holds them apart from a true closed-trade hit rate and hands a hit rate and a finish yet another way to part.
From the Price Feed to the Verdict, and How We Made It
Trace one figure backward from this page and you land on a live market tick. Each season a real-time price feed drove a paper account; when the season closed, a deterministic program reads that account's report, its decision log and its equity snapshots, materializes the head-to-head from them, and certifies the result with a content hash it writes into the evidence pack. At build time this page is checked against that hash before it renders, so the language model that arranged this prose never got to invent a number. Within any single season the inputs were held identical for both — the same $10,000 starting bankroll, the same once-a-day decision slot, the same asset list off the same price feed — and everything downstream, the thesis and the orders, each model produced on its own. What did shift between seasons — the model builds, the tradable universe, the way the market resolved — is named on the page rather than smoothed into an average. Fills were priced against live data under a modeled 0.1% fee; what the run never charged for was slippage, market impact or the cost of borrowing to short.
Limitations: Each Claim With Its Caveat Attached
Rather than pool the cautions at the end, take each headline claim with its own attached. The 2-1 is real on the head count — but it spans 3 shared seasons, which is 3 observations, and the model builds, asset universe and market all turned over between them, so it is a repeated head-to-head, not one controlled experiment. Season 5's +21.81-point gap is a returns figure, and returns fold in unrealized P&L: Gemini's +13.76% sat on +$1,439.66 of open gains over a -$63.57 realized loss, and MiniMax's -8.05% on -$846.45 realized under +$41.13 open — both books simulated, so a headline and a settled account can part ways. The matched Season 5 behavior — 8 orders each, 8.84% against 8.90% drawdown — is descriptive: drawdown is a single worst-moment number off the same equity path as the return, the pack carries no volatility field beside it, and matched activity across 2 accounts explains nothing about the opposite results. The win rates are report figures that still count open positions among the trades, which leaves them a step short of a closed-trade hit rate. The 4 opening decisions are read from position-state shifts between one daily snapshot and the next, not from fills, so a trade opened and closed inside a single cycle leaves no trace. And the behavior is described with its sample size, never as a fixed trait of Gemini or MiniMax; hold-time and profit factor were never archived, so they are left out rather than guessed. On this benchmark the read stays narrow: MiniMax holds the 2-1 on 2 tight seasons, Gemini's single win is wide enough to carry the average gap, and the lone season the two matched on the logged behavior columns — order count and drawdown — is the one they finished furthest apart. Every figure sits in the Gemini vs MiniMax evidence pack.