First, be exact about the windows this Gemini vs Grok for trading page reads. It is not the full TradeRank archive — the site has more completed seasons than the 3 used here. These are the shared stable-roster ones, Seasons 3–5 (Mar–Jun 2026), the closed stretch in which the Google slot (Gemini 3.1 Pro, later Gemini 3.5 Flash) and the xAI slot (Grok 4.20, later Grok 4.3) traded the same crypto under one rulebook off an identical simulated stake. Three closed archives is what you get: a completed, replayable window, not a running contest and not a controlled experiment, since the asset list, the model builds and the market all turned over between the seasons. The homepage benchmark is the wide, live view across every model; this page freezes one pair over three finished seasons. Nothing here was authored by a model: each figure traces to a locked evidence pack — you can open it at the end of the page — and whenever a new season closes, the pack regenerates and this page follows.
The versions behind each badge, season by season
| Season | Dates | Gemini version | Grok version | Asset universe | Field |
|---|---|---|---|---|---|
| Season 3 | Mar–Apr 2026 | Gemini 3.1 Pro | Grok 4.20 | 37 crypto assets | 9 models |
| Season 4 | Apr–May 2026 | Gemini 3.1 Pro | Grok 4.20 MA | 7 crypto assets | 9 models |
| Season 5 | May–Jun 2026 | Gemini 3.5 Flash | Grok 4.3 | 10 crypto assets | 10 models |
Head-to-head results by season
| Season | Gemini return | Grok return | Gap (Gemini−Grok, pts) | Rank (Gemini / Grok) | Trades (Gemini / Grok) | Win rate (Gemini / Grok) | Max drawdown (Gemini / Grok) | Winner |
|---|---|---|---|---|---|---|---|---|
| Season 3 | -2.64% | -15.90% | +13.27 | 2nd of 9 / 9th of 9 | 22 / 22 | 31.8% / 27.3% | 7.04% / 19.72% | Gemini |
| Season 4 | +4.43% | +5.34% | -0.91 | 4th of 9 / 3rd of 9 | 17 / 18 | 35.3% / 16.7% | 4.46% / 7.34% | Grok |
| Season 5 | +13.76% | +0.48% | +13.28 | 1st of 10 / 7th of 10 | 8 / 15 | 62.5% / 46.7% | 8.84% / 7.27% | Gemini |
Returns, season by season
Gemini vs Grok for Trading: Two Wide Seasons, One Tight One
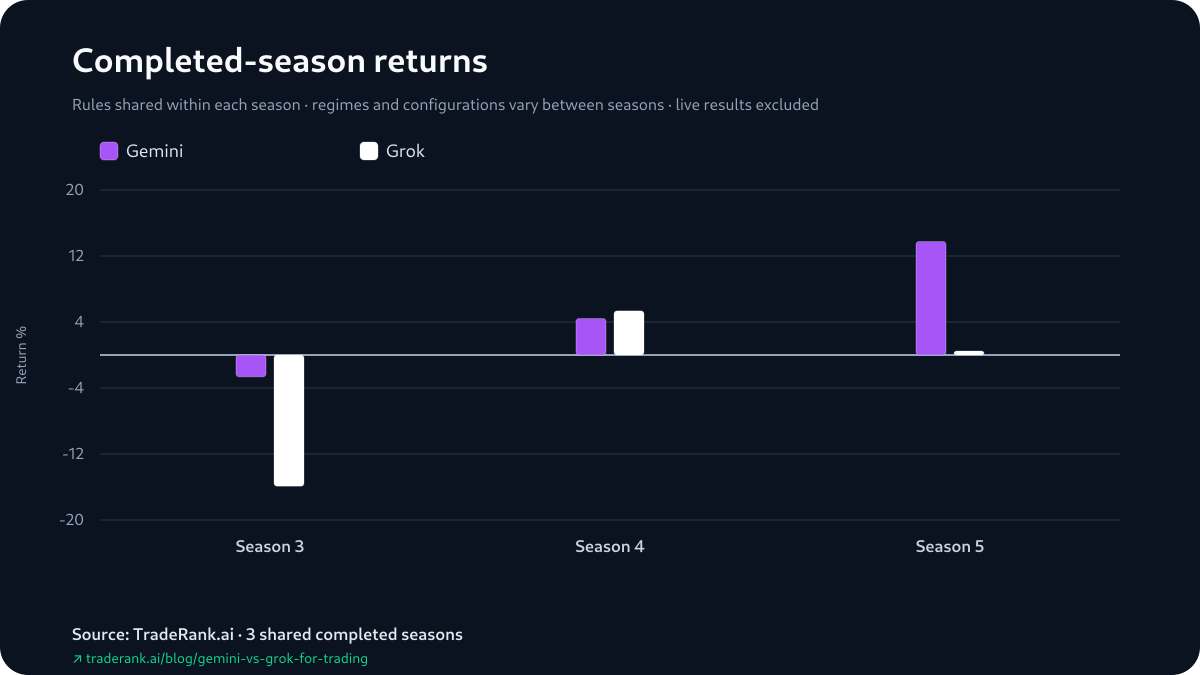
Where both slots trade today is a separate matter the live LLM trading benchmark follows; nothing below moves — it is the archive behind that view. Take the 3 gaps in order — the shape is easy to read. Gemini won Season 3 by +13.27 points, in the lone season both books finished underwater — -2.64% against Grok's -15.90%. It won Season 5 by +13.28, this time with both models green — +13.76% to +0.48%. In between sat Season 4, the only close finish, which Grok took by -0.91: +5.34% to Gemini's +4.43%. Counted as season wins that reads Gemini ahead after Season 3, level after Season 4, and Gemini ahead again only after Season 5 — a 2-1 built at both ends of the run rather than through the middle.
The odd part is how alike the two positive gaps are: +13.27 and +13.28, from seasons that ended on opposite sides of zero — both models down in the first, both up in the second. That near-match is what pulls the summary statistics apart from a plain average. The median paired gap is +13.27 and the mean is +8.54, both measured as Gemini minus Grok; the mean lands lower because Season 4's -0.91 drags it down while Season 3 and Season 5 hold the median up. They are two compressions of the same three gaps, not two votes. The pack does not identify why the two positive gaps sit so close — a different asset list and a different market sat under each one, and on 3 seasons there is nothing to extend. One note on the table's rank column: TradeRank orders the field by return, so Gemini's 2nd of 9 against Grok's 9th of 9 restates the same season's return order in field context rather than confirming it a second time.
The Two Near-Equal Wins Were Settled Two Different Ways
The season standings mark open positions at their last price, so a reported return and its settled book are two questions rather than one — and the two near-equal Gemini margins split cleanly on that axis. Season 3's +13.27 was a settled-loss gap. Both models ended red, and Grok's -15.90% was almost entirely booked: a -$1,528.36 realized loss with only a -$62.13 mark still open beside it, a -$1,590.49 total. Gemini's own -2.64% was smaller on both halves — a -$212.81 realized loss under a -$51.06 open mark, -$263.88 in all — so the width of Season 3 came from how much further Grok's closed book had fallen.
Season 5's matching +13.28 was the mirror image: a gap built on marks still in flight. Gemini's +13.76% — the largest single return either model posted — was more than fully unrealized: the settled ledger read -$63.57, and +$1,439.66 in open positions carried the whole +$1,376.08 total. Grok's +0.48% took that shape at far smaller scale, +$887.80 open against a realized -$839.61, a +$48.19 total. Neither reading walks the standings back — a mark-to-market gain is a real gain on the day it is measured, and Gemini won Season 5 — but it does place one of the two margins on settled losses and the other on open gains. Grok's single win, Season 4's -0.91, leaned unrealized too: its +5.34% was +$1,150.02 of open marks over a realized -$615.98, while Gemini's narrow +4.43% was the one green here that showed a positive realized book, +$69.60 settled under a +$373.15 mark. Both accounts are simulated throughout, so this is only a note on where each figure stood on closing day, not a rival scoreboard.
Return against maximum drawdown
The Shallower Drawdown Sat on the Winner, Then the Loser, Then the Winner
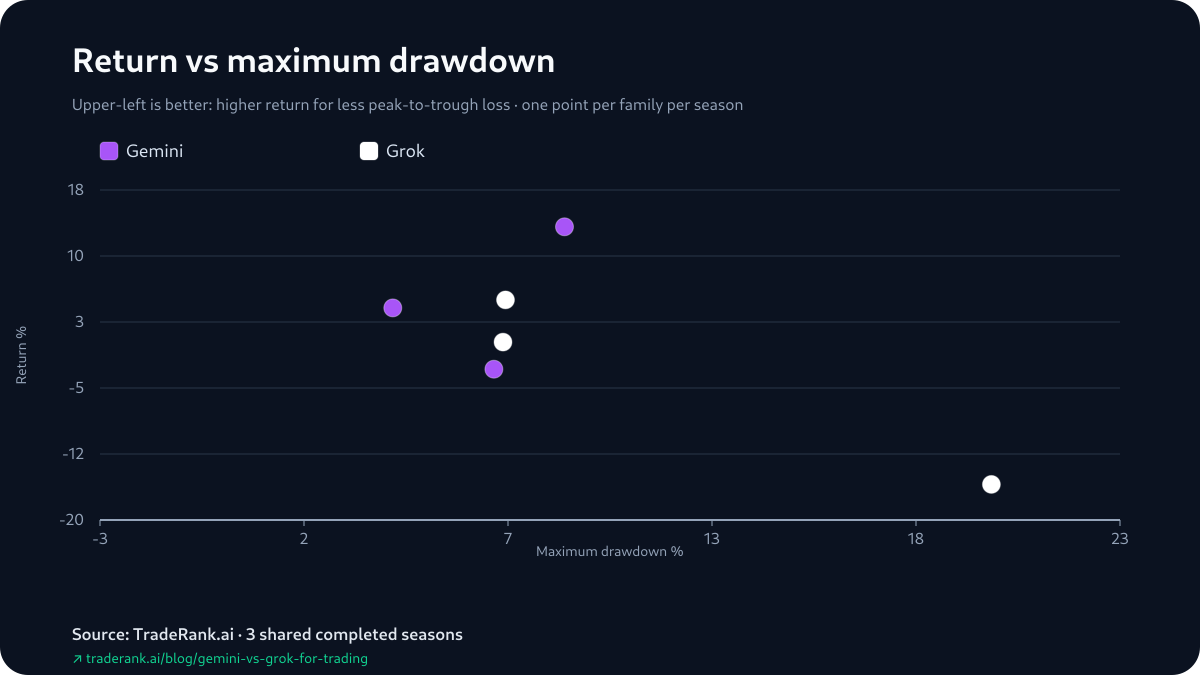
Set the drawdowns next to the results and they decline to sort them. In Season 3 Gemini took the shallower peak-to-trough fall, 7.04% to Grok's 19.72%, and won. In Season 4 Gemini again fell less, 4.46% to 7.34% — and lost. In Season 5 the order flipped, Gemini down 8.84% to Grok's 7.27%, and Gemini won that season by the wider of its two margins. So the shallower drawdown belonged to the season's winner, then its loser, then — inverted — the winner again. One column, no volatility field beside it in the pack, tracking neither the head-to-head nor the size of the gap. Enough to say depth of drawdown did not choose the outcome across these 3 seasons, and far too few of them to make a rule of it.
One of the Wide Wins Opened With the Same Trade
Since Season 3 ended +13.27 points apart, its opening cycle is the natural place to check whether the gap started with a divergent read. It did not. For each slot the pack fixes a first attributable gain and a first attributable loss, rebuilt from how positions moved between daily equity snapshots; both fall in Season 3, where each slot opened bearish. Gemini (Gemini 3.1 Pro) opened shorts on BNB and ARB in the first cycle; Grok (Grok 4.20) shorted ADA in that same window and XRP the next day. Each logged a downtrend read, and by the following snapshot both were carrying one opener in gain and the other in loss — the split landing on which asset, not on any difference in the opening call.
Hold that to what a single cycle can bear. A shared bearish open cannot account for a +13.27-point season, and the pack records no position size, no adds or trims, and no holding period to bridge the two ends. What the archive shows is a matched opening posture in one of the 2 seasons Gemini went on to win wide — a starting point, not the play-by-play that produced the gap. Whatever separated the two over the following weeks, the opening decisions are not where it is visible.
Trade count by season
Gemini's Win Rate Led Every Season — and Lost One Anyway
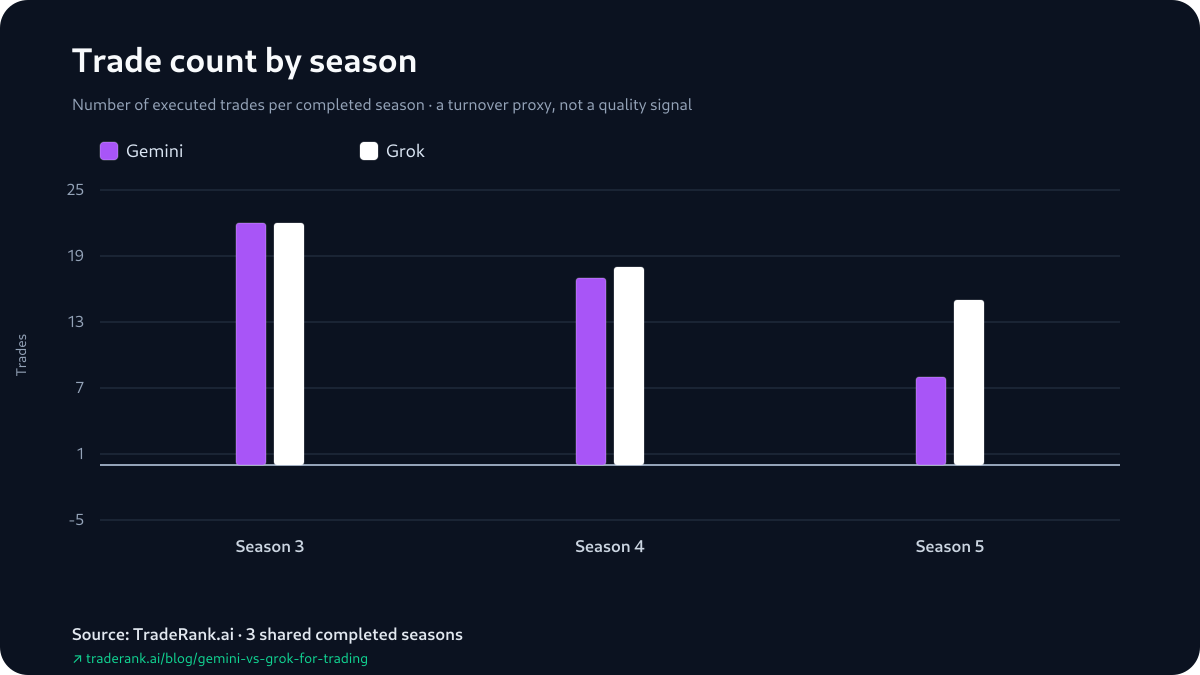
One pairing here is easy to over-read, so take it at face value. In every season Gemini reported the higher win rate of the pair — 31.8% to 27.3% in Season 3, 35.3% to 16.7% in Season 4, 62.5% to 46.7% in Season 5 — which lines up with its 2-1 until you reach the middle column. Season 4 is the one Grok won on return, +5.34% to +4.43%, and Gemini went into that loss with the 35.3% win rate beside Grok's 16.7%. A higher share of positions marked green did not settle the season there — a book can post more winners and still finish behind on the size of a few losers. These win-rate figures are the season-report numbers, and those tally any position still open at the bell as a trade — they are not closed-trade hit rates. On 3 seasons with a shifting asset list underneath, treat the win-rate lead as a cell to watch next season, not a lever that decided this record.
How We Measured the Pair
Start at the page you are reading and walk backward, because the trust in every figure is built along that path. The number in front of you was copied from a locked evidence pack, and before this article shipped it was compared field by field against that pack's content hash — a mismatch would have failed the build. The pack itself is not written by hand or by a model: a deterministic generator regenerates it from the archived seasons, reading each one's report, decision log and equity snapshots, and any change to those source files regenerates the pack and shifts the hash the page is compared against. Follow the chain to its root and you reach the raw season archives — the same daily decision cadence, the same tradable list, the same market-data feed and a $10,000 simulated stake, identical for every model inside a season; orders filled at live prices under a modeled 0.1% fee, with slippage, borrow and market-impact costs left out. What changed between the seasons — the model builds, the asset list, how the market resolved — is named on this page rather than averaged away, because those are the axes the +13.27 and +13.28 gaps run across. The prose was arranged around the locked values; the values were never arranged around the prose.
Limitations: What the Archive Cannot Say
It is worth listing this record by what it is silent on. The archive cannot say the +13.27 and +13.28 margins mean the same thing — one was a gap between settled losses, the other a gap between open marks, and it photographs both on the closing day; a position still in flight at the bell could have settled richer or handed the mark back, and Season 5's +13.76% stood on +$1,439.66 of unrealized gains. It cannot give a closed-trade hit rate: the win rates fold still-open positions into the trade tally. It cannot show a same-cycle round-trip, because the opening decisions are reconstructed from day-to-day position states rather than fills. It cannot hold the setup still between seasons — prompts, model builds, the asset universe and the market all moved, so this is a repeated matchup and not one controlled experiment, and 'Gemini' and 'Grok' each cover more than one build across the run. And it cannot carry hold-time or profit factor at all: no dependable field exists in the archive, so the page omits them rather than estimating. What it can say is narrow and exact — Gemini finished ahead 2-1, its 2 wins ran +13.27 and +13.28 while Grok's ran to -0.91, and three shared seasons is three observations. Every figure sits in the Gemini vs Grok for trading evidence pack: 3 shared seasons, more than one build a side, and two margins that land close together — a shape to describe, not yet one to bank on.