This Kimi vs GLM for trading comparison is frozen to a dated snapshot taken when Season 5 — the last completed season in this set — closed its books; the evidence pack underneath regenerates only after a further season completes, so a refresh shows up as a new dated pack, never as numbers drifting in place. Those 3 seasons, the shared stable-roster run of Seasons 3-5, are where the Moonshot AI slot (Kimi K2.5, then Kimi K2.6) and the Zhipu AI slot (GLM-5, then GLM-5.1) traded the same crypto under one rulebook. Across them Kimi holds the head-to-head 3-0 — and underneath the count sits the plainer fact this page keeps returning to: GLM finished all 3 of those seasons below zero. The reading is deliberately narrow: TradeRank's archive holds more completed seasons than the 3 in scope, and the homepage benchmark spans the full roster; this page confines itself to the seasons these two shared. As for the numbers below, none originate in prose — each is read out of a locked, hash-stamped pack file, and the final section links that file so any figure can be checked against it.
The builds behind each name, season to season
| Season | Dates | Kimi version | GLM version | Asset universe | Field |
|---|---|---|---|---|---|
| Season 3 | Mar–Apr 2026 | Kimi K2.5 | GLM-5 | 37 crypto assets | 9 models |
| Season 4 | Apr–May 2026 | Kimi K2.6 | GLM-5.1 | 7 crypto assets | 9 models |
| Season 5 | May–Jun 2026 | Kimi K2.6 | GLM-5.1 | 10 crypto assets | 10 models |
Head-to-head results by season
| Season | Kimi return | GLM return | Gap (Kimi−GLM, pts) | Rank (Kimi / GLM) | Trades (Kimi / GLM) | Win rate (Kimi / GLM) | Max drawdown (Kimi / GLM) | Winner |
|---|---|---|---|---|---|---|---|---|
| Season 3 | -6.35% | -7.67% | +1.32 | 5th of 9 / 7th of 9 | 23 / 20 | 26.1% / 20.0% | 10.21% / 9.46% | Kimi |
| Season 4 | +4.13% | -0.57% | +4.70 | 5th of 9 / 9th of 9 | 18 / 7 | 27.8% / 28.6% | 4.18% / 0.75% | Kimi |
| Season 5 | +5.78% | -1.90% | +7.69 | 4th of 10 / 9th of 10 | 14 / 23 | 50.0% / 39.1% | 10.60% / 7.45% | Kimi |
Returns, season by season
Kimi vs GLM for Trading: The Sweep Read in Order
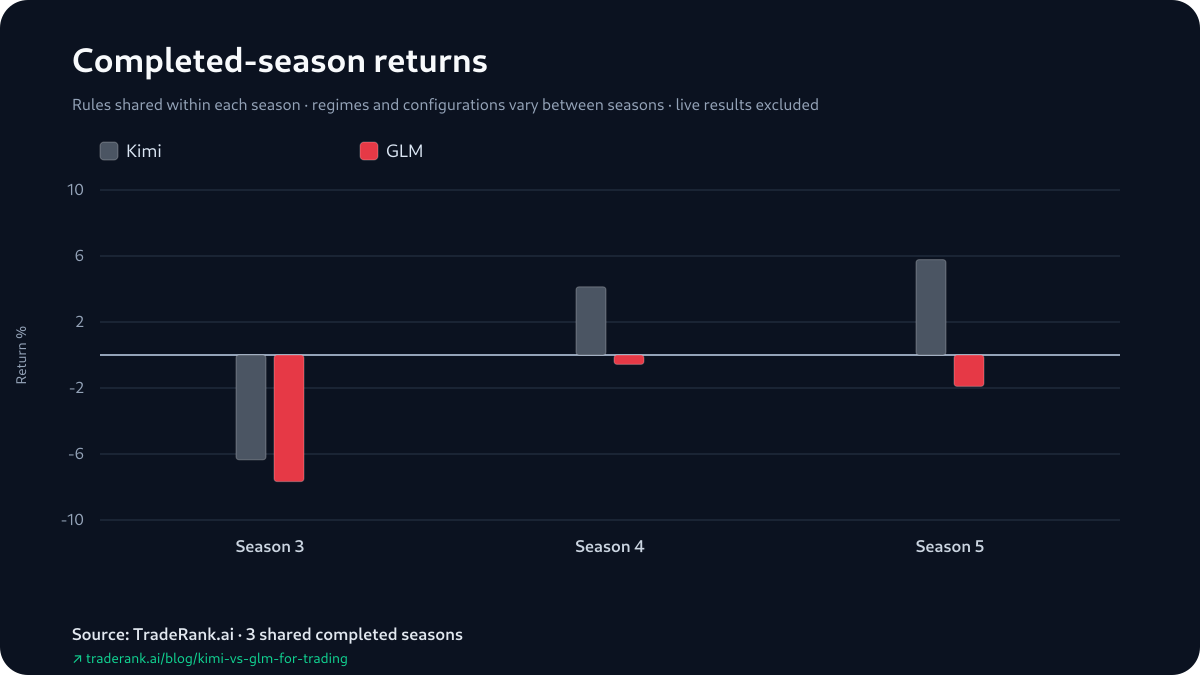
Where these two slots stand today is a question for the live LLM trading benchmark, which updates as new cycles close; this page looks only backward, at seasons already settled. Taken in that settled order, the story is not that the winner changed — it never did — but that the distance grew. In Season 3 both models lost, Kimi -6.35% against GLM's -7.67%, a gap of +1.32 points (every gap here is Kimi minus GLM). Season 4 opened that to +4.70, with Kimi turning positive at +4.13% while GLM slipped to -0.57%. Season 5 pushed it to +7.69, Kimi at +5.78% over GLM's -1.90%. So the 3 season gaps run +1.32, +4.70, +7.69 — larger at each step. The median of them is +4.70 (that is Season 4, the middle value) and the average +4.57; both lean Kimi's way. What the sequence actually says is modest: over 3 shared seasons Kimi won each one, and each time by more than the last.
GLM Never Closed One of These Seasons Green
One line under the sweep does most of the work: GLM finished every shared season in the red — -7.67%, then -0.57%, then -1.90% — while Kimi finished Season 4 and Season 5 in the black. That is the asymmetry the head-to-head is built on. GLM's finishes never crossed zero; its nearest approach was the -0.57% of Season 4. Kimi crossed twice. Field rank tells the same thing a second way, since the leaderboard simply orders each season's return against the rest of the field: Kimi placed 5th of 9, 5th of 9, then 4th of 10, while GLM placed 7th of 9, then 9th of 9 — last in that field — then 9th of 10. Rank is that return restated among the other models, so it is placement context rather than a separate verdict; what the context records is where each return fell in its field, and nothing more.
How Much of Kimi's Green Had Actually Settled
The standings value open positions at their closing mark, so a season's headline return is one figure and the cash it had banked is another — and Kimi's Season 5, the season of the +7.69 gap, is where the two disagree outright. That +5.78% finish combined -$478.43 in realized cash with +$1,056.75 in open marks, +$578.32 all told; on banked cash alone, the season that closed the sweep was a loss. Season 4's +4.13% needed no such rescue: +$269.81 realized and +$143.29 in open marks, +$413.11 in all, positive on each half. GLM's Season 5 came to -$190.32 in total, from -$488.16 realized against +$297.85 in open marks; its Season 4 came to -$56.92, from -$65.46 realized against +$8.54 in marks. Both books were negative from end to end in Season 3: Kimi's -$635.24 total breaks into -$551.61 realized plus a -$83.63 mark, GLM's -$767.43 into -$721.59 realized plus a -$45.85 mark. None of this re-scores anything. The standings count the return with open marks folded in, and by that count Kimi swept; the realized column speaks only to how each finish was arrived at, and on both sides the account was a simulated one.
Return against maximum drawdown
The Shallower Fall Belonged to the Model That Lost
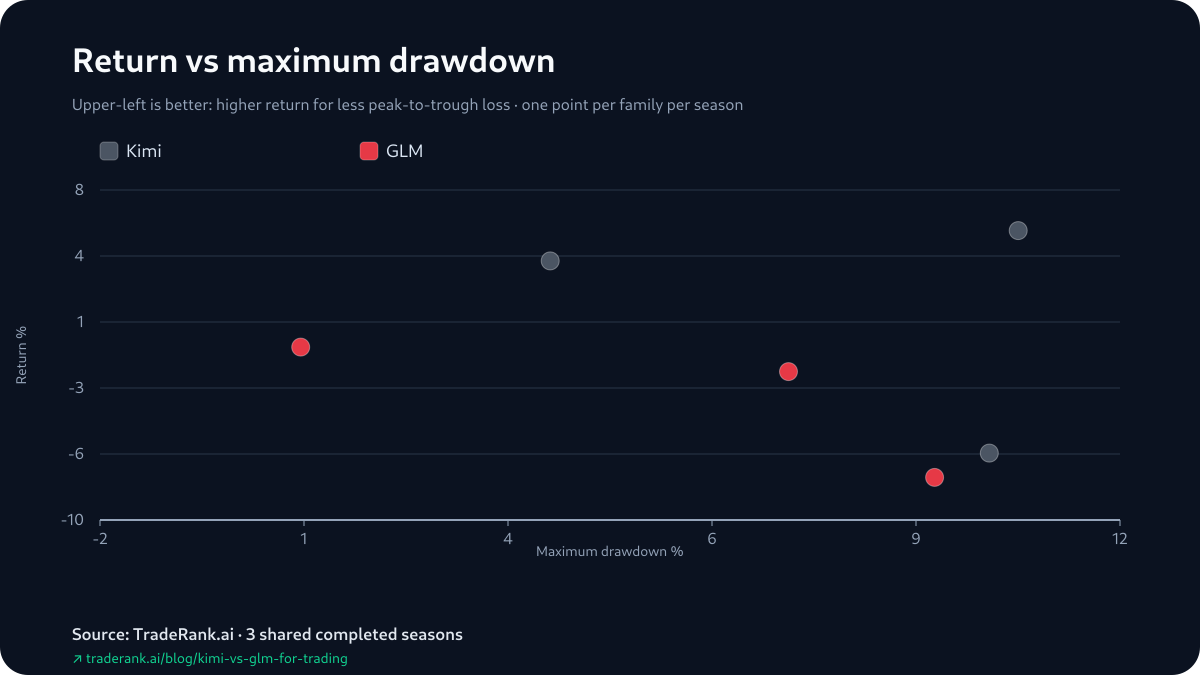
The one risk column the pack carries points the opposite way to the result, cleanly and every time. GLM took the smaller maximum drawdown in Season 3 (9.46% to 10.21%), in Season 4 (0.75% to 4.18%) and in Season 5 (7.45% to 10.60%) — and lost all 3. Its Season 4 fall of 0.75% is the shallowest number either model posted across the run, in a season it finished 9th of 9. So the model that fell less each season is the model that finished behind each season; the smaller drawdown never once sat with the winner. Read that as a coincidence held together by a short sample, not a rule: there is no second volatility field beside this one to corroborate it, and with 3 seasons under builds and asset lists that changed each time, a drawdown that runs opposite to the finish is worth noting and not worth stretching. A shallower maximum drawdown is not a higher return, and across these 3 seasons the two pointed opposite ways.
The Openings the Pack Can Show
Four decisions are all the pack preserves from either slot. The selection is mechanical: for each model, whichever opening first showed a positive mark between one daily snapshot and the next is kept as the gain, and whichever first showed a negative one is kept as the loss — value movement decides, not entry order. They divide by timing as much as by ticker. GLM (GLM-5) put both of its logged openings on Season 3's first cycle: a short on ADA that the next snapshot marked into gain, and a short on ARB, opened in the same cycle, that it marked down. Kimi's (Kimi K2.5) came a day or two later — a short on XRP that became its logged loss, then a short on DOT the next day for its logged gain. All four are shorts in a Season 3 that ended red for both, but the notes behind them lean on different evidence: GLM's ADA entry read every timeframe as bearish at once, its ARB entry rested on a weekly downtrend it called dominant, and Kimi's XRP note pointed at price structure — "the clean breakdown from $1.55 to $1.40" — as what validated the short. Hold these to what four openings can carry, which is little. The pack rebuilds each one from how a position was marked day to day, not from the fills themselves, so a trade opened and shut within the same day leaves no mark; and it stores no position size, no scaling in or out, and no holding period. What is left is a shared downward lean in the season's opening days, spread across four coins, and silence about the weeks that actually settled the 3 seasons.
Trade count by season
Activity Ran One Way, the Result the Other
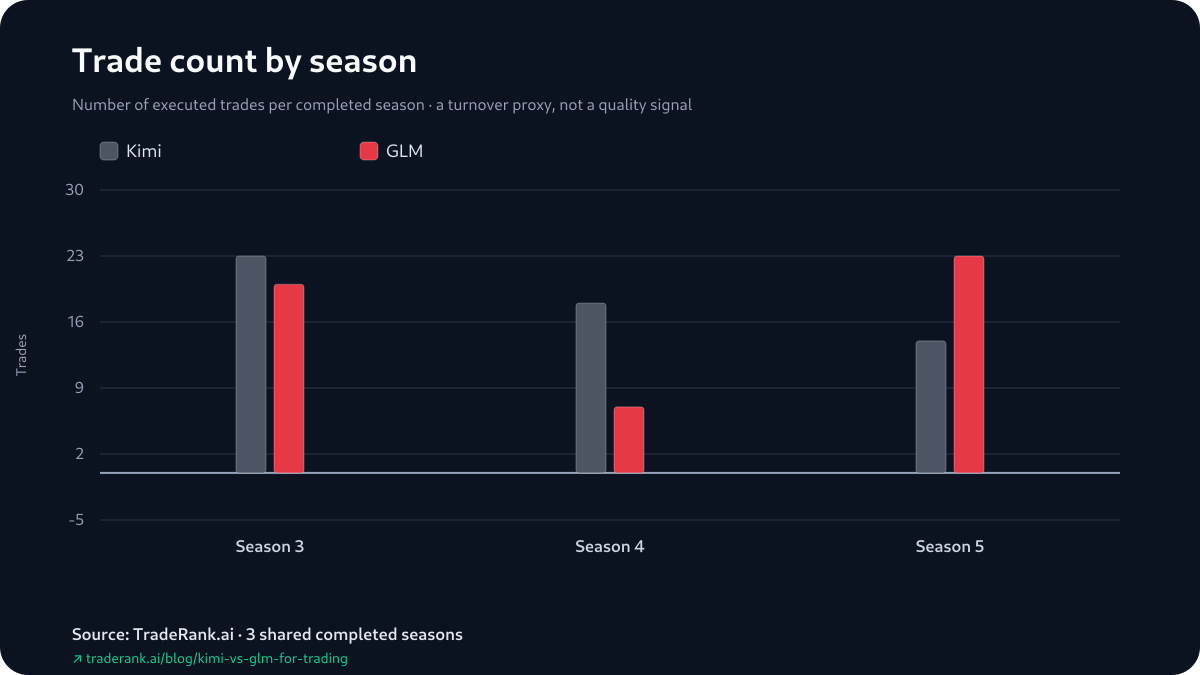
How often each model traded does not line up with the sweep. Kimi's trade count fell across the run — 23, then 18, then 14 — while GLM's moved without a direction, 20, then 7, then 23. The sweep's final season is also the one where Kimi logged 14 trades to GLM's 23. The reported win rates cut across the record too, and they carry a caveat before they carry a meaning. Kimi's share of positions marked green topped GLM's in Season 3 (26.1% to 20.0%) and Season 5 (50.0% to 39.1%), but GLM's edged Kimi's in Season 4 (28.6% to 27.8%) — a season Kimi won by +4.70 points. These come out of the season reports, and those reports count any position still open at the close as a trade, so the figure here is not a closed-trade hit rate and belongs beside the realized/unrealized split above. Over 3 seasons with a fresh asset list each time, read the rates as texture rather than explanation.
How We Measured This — and Where It Could Mislead
No language model produced a number on this page, and it is worth saying how that is guaranteed before trusting a single figure above. A deterministic generator builds the evidence pack out of each archived season's report, decision log and equity snapshots, then binds every figure here to the content hash stamped into that pack; a language model arranged the sentences but authored none of the statistics. That machinery locks the arithmetic, not the reading of it, and the reading has a handful of ways to go wrong that are better named than buried. A headline return counts open positions at their closing mark, so it can sit higher than the cash a season had actually locked in — the reason the realized/unrealized split runs above it, to fence that gap, with Kimi's Season 5 the sharp example of a green finish on a red realized book. A field rank is only that same return sorted against the rest of the table, so it thickens the picture without adding a fresh measurement. The four surfaced decisions are rebuilt from day-to-day position marks rather than fills, which means a trade opened and shut inside a single day never shows. And the whole comparison is 3 seasons deep, each carrying its own builds, prompt, asset list and market — the largest way this can mislead, and the one no rigor inside a single season can repair. Within a season the two slots did share a setup: one decision per day, an identical tradable list, quotes off one market feed, and a $10,000 paper stake apiece, fills priced at the live market with a 0.1% fee folded in and slippage, borrow and market impact all left out. Once a season ends none of that carries over, so a 3-0 reads as one matchup rerun 3 times under shifting conditions, not a single pinned-down experiment.
Limitations: Pressure-Testing the Never-Green Record
The claim doing the most work on this page is a paired one: Kimi swept, and GLM never once closed one of these seasons green, with the gaps rising in order (+1.32, +4.70, +7.69). Lean on that claim and you can feel where it gives. The ordered step is 3 numbers, and 3 neighbouring margins that all tilt one way are the easiest thing in the world to read too much into: a single differently-shaped season would scramble the order, and nothing in the run foretells a fourth. The next support is the finalization rule: because open positions are booked at their last mark, every return and every rank is a snapshot of the closing day rather than a settled ledger — and Kimi's Season 5, positive on the mark but negative on realized cash, is the season where mark and ledger point in opposite directions. Then there is the sample itself: 3 shared seasons, with 'Kimi' spanning 2 builds and 'GLM' spanning 2, a tradable list that went 37 names to 7 to 10, and a market that ended each season on its own terms; even the surrounding field shifted, from 9 models to 9 to 10. The counter-texture sits in the risk column — GLM held the shallower drawdown in every season and lost in every season, so anyone minded to argue for GLM on risk grounds has a genuine number to cite; it simply never came with the better return. The win rates carry their open-position caveat; the rebuilt opens skip anything round-tripped inside a day; hold-time and profit factor have no trustworthy archived value, so they are dropped rather than guessed. What comes through all of it is narrow and firm: over 3 shared seasons Kimi leads GLM 3-0, the season margins came to +1.32, +4.70 and +7.69, and GLM ended every one of them below zero. The Kimi vs GLM trading evidence pack carries every one of those figures, and each other number here, fixed at the close of Season 5.