Most people asking about Grok vs MiniMax for trading want to know which model is the better trader. A 3-season record cannot answer that; it can only say which one finished ahead, and under what conditions it did so. Start with the conditions, then. This page reads a closed, bounded archive — the 3 stable-roster seasons, Seasons 3–5, in which xAI's Grok slot (Grok 4.20, then Grok 4.20 MA, then Grok 4.3) and the MiniMax slot (MiniMax M2.5, then MiniMax M2.7 — MiniMax here is the AI company's M2 model line, not the minimax search algorithm) traded the same crypto under one rulebook off a matched simulated stake. The homepage benchmark ranks the whole field over more completed seasons; this page reads just these two columns of it. And none of the figures were typed in or model-written: they come out of a locked evidence pack linked at the end, and when a later season completes, the pack is rebuilt and this page follows it.
The builds behind each slot, season by season
| Season | Dates | Grok version | MiniMax version | Asset universe | Field |
|---|---|---|---|---|---|
| Season 3 | Mar–Apr 2026 | Grok 4.20 | MiniMax M2.5 | 37 crypto assets | 9 models |
| Season 4 | Apr–May 2026 | Grok 4.20 MA | MiniMax M2.7 | 7 crypto assets | 9 models |
| Season 5 | May–Jun 2026 | Grok 4.3 | MiniMax M2.7 | 10 crypto assets | 10 models |
Head-to-head results by season
| Season | Grok return | MiniMax return | Gap (Grok−MM, pts) | Rank (Grok / MM) | Trades (Grok / MM) | Win rate (Grok / MM) | Max drawdown (Grok / MM) | Winner |
|---|---|---|---|---|---|---|---|---|
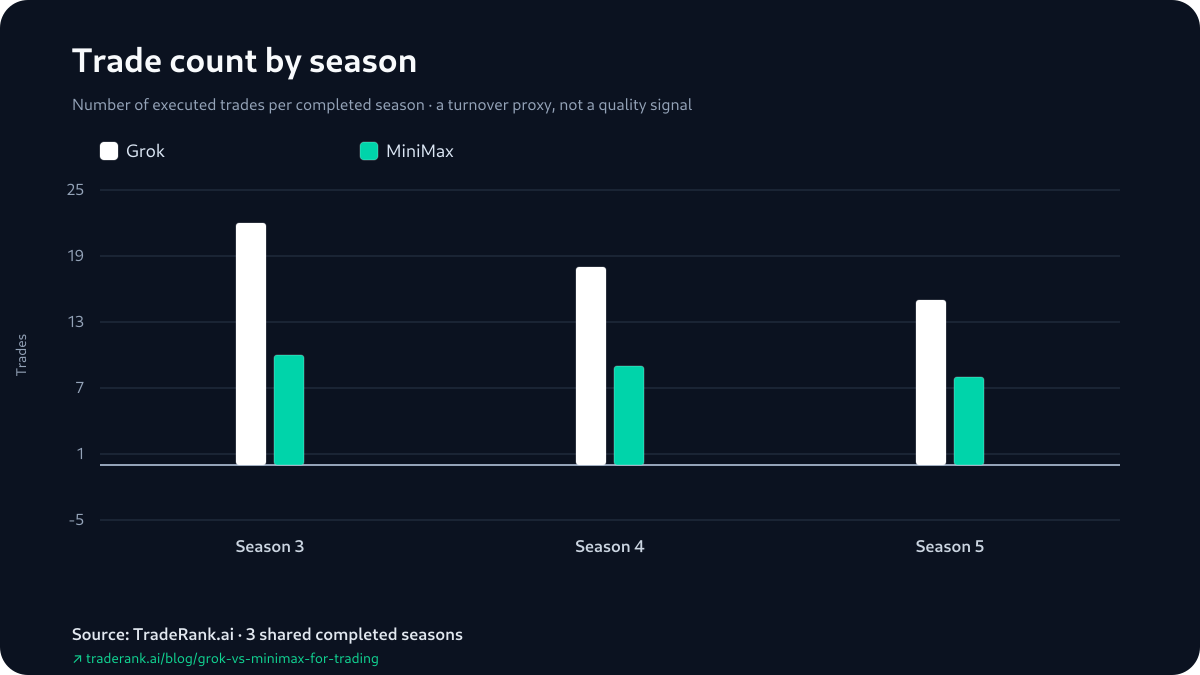
| Season 3 | -15.90% | -0.63% | -15.27 | 9th of 9 / 1st of 9 | 22 / 10 | 27.3% / 20.0% | 19.72% / 4.11% | MiniMax |
| Season 4 | +5.34% | +6.94% | -1.60 | 3rd of 9 / 1st of 9 | 18 / 9 | 16.7% / 55.6% | 7.34% / 2.45% | MiniMax |
| Season 5 | +0.48% | -8.05% | +8.54 | 7th of 10 / 10th of 10 | 15 / 8 | 46.7% / 37.5% | 7.27% / 8.90% | Grok |
Returns, season by season
Grok vs MiniMax for Trading: What Each Win Was Worth
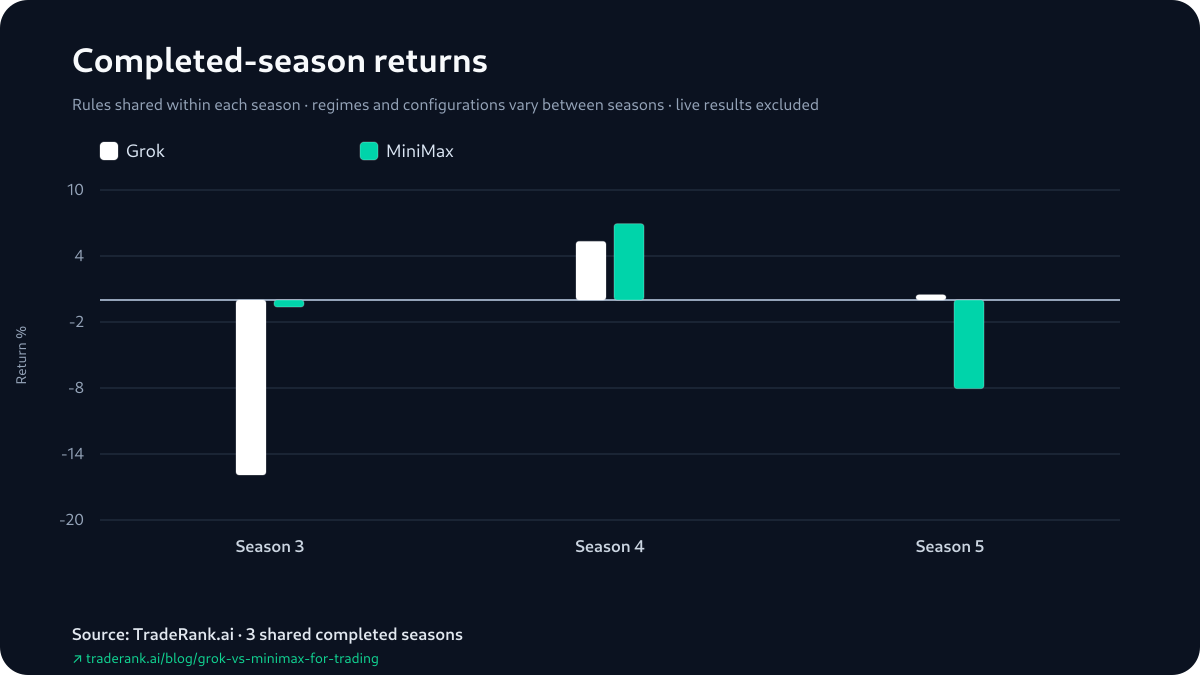
Read the 3 seasons in order. MiniMax won Season 3, when both finished below their starting stake — -0.63% against Grok's -15.90%, a gap of -15.27 points (Grok minus MiniMax, as everywhere on this page). It won Season 4 as well, +6.94% to +5.34%, by -1.60. Grok took Season 5, +0.48% to MiniMax's -8.05%, by +8.54. Counted as season wins, that reads MiniMax ahead after Season 3, ahead again after Season 4, and 2-1 once Grok took Season 5 — a lead MiniMax held from the opener, that Grok narrowed but never drew level. The two gap summaries both sit on MiniMax's side: a median of -1.60 and an average of -2.78, both drawn from the same 3 gaps. The average runs below the median because Season 3's -15.27 is the largest of the three and pulls it down. The live LLM trading benchmark tracks where the two slots stand now; none of the figures on this page move with it. One note on the rank column above: a season's field rank is fixed by that season's return, so MiniMax's 1st against Grok's 9th re-expresses the return order in field context rather than confirming it on its own.
Return against maximum drawdown
The Shallower Drawdown and the Win Sat Together — on One Curve
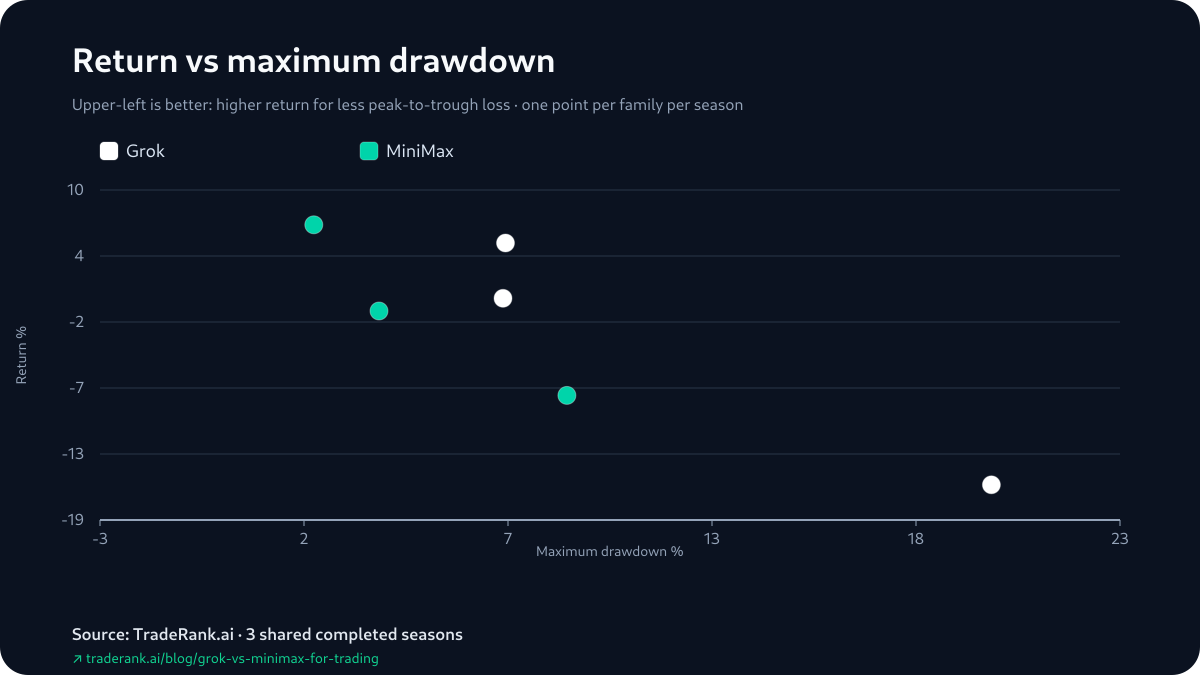
Line the drawdowns up against the results and, this time, they point the same way: the model with the smaller maximum drawdown also finished ahead in each of the 3 seasons. MiniMax fell 4.11% to Grok's 19.72% in Season 3 and 2.45% to 7.34% in Season 4, and won both; in Season 5 the order flipped and Grok fell less, 7.27% to MiniMax's 8.90%, in the season Grok took. That agreement is worth less than it looks. Maximum drawdown and return are both read off the same equity path — a model that ends a season higher has usually dipped less along the way — so this is one measurement seen twice, not drawdown independently ratifying the finish. It is also the pack's single risk measure; no volatility field sits beside it.
The Opening Cycle: One Shared Short, Two Different Misses
For each model the pack surfaces a single first-attributable gain and a single first-attributable loss — reconstructed as position-state changes between daily snapshots, not read off trade fills. Both models opened Season 3 the same way: a short on ADA in the first cycle, each reading a fully aligned downtrend across the weekly and daily timeframes, and by the next snapshot both were carrying that ADA short in the green. Where they parted was the first short that went against them — Grok's on XRP, MiniMax's on ETH. The pack records no position sizing, no adds or trims, no hold-time — so the reconstruction ends at those two matched opening reads, and the rest of each season sits outside what it can show.
Trade count by season
A Higher Win Rate That Lost the Season
Win rate here is the share of a model's positions marked green, lifted directly from each season's report — and those reports tally any position still open at the bell as a trade, so it is a marked-green rate rather than a closed-trade hit rate. It also did not sort these two. In Season 3 Grok's win rate, 27.3%, was higher than MiniMax's 20.0%, and Grok still finished the season at -15.90% to MiniMax's -0.63% — more green positions, a far worse finish. The later seasons ran the other way: MiniMax's 55.6% over Grok's 16.7% in Season 4, which MiniMax won, and Grok's 46.7% over MiniMax's 37.5% in Season 5, which Grok won. A rate that names the loser once and the winner twice, over 3 seasons with the asset list shifting under it, is a column worth another season's look, not a dial either model was turning.
How This Pair Was Measured — and What It Assumes
Every reading on this page rests on a short stack of assumptions, so here they are in one place. That within a season the two slots met identical conditions — one daily decision cycle, one tradable list, one live market feed, a $10,000 simulated stake each, and a modeled 0.1% fee on every fill. That returns include open positions marked to their last price, which is why a headline and a settled book are separate lines above. That field rank follows directly from return. That between seasons almost nothing held still: the prompt, the model build, the asset list and the market itself all turned over across Seasons 3–5. And that slippage, borrow costs and market impact were never charged, so the fills here are cleaner than a funded desk would ever see. As for who did the counting: a deterministic generator renders every value in the evidence pack from each season's archived report, decision log and equity snapshots, and the published page is vetted against the pack's content hash before it ships — the words on this page were fitted to the pack's values, never the values to the words.
Limitations: The Same Cells, Read by a Skeptic
Take the exact numbers above and hand them to a skeptic, and most of the page's claims soften. The finished-ahead-not-up framing — -0.63%, +6.94% and +0.48% from the season winners — is one reading of 3 cells; a skeptic reads the same cells as two simulated books that finished either side of zero in different orders. The drawdown agreement collapses to one equity curve measured twice. Even the version labels cut against a clean story: 'Grok' spans 3 builds and 'MiniMax' 2, so a season-to-season change could be the model or the month. None of that makes the record wrong; it makes it small. 3 shared seasons is 3 observations, gathered under conditions that never repeated, and a fourth season would arrive with a new build, a new asset list and a new market attached. What the page can stand behind is narrow and exact: MiniMax finished ahead in 2 of the 3 seasons, the winning returns were -0.63%, +6.94% and +0.48%, and every one of those figures sits in the Grok vs MiniMax evidence pack.