Each of these seasons ran a field of 9 or 10 models, so start with where the two in question landed inside it. Google's Gemini — the Gemini AI line, not the crypto exchange of the same name — finished 2nd, 4th and 1st of its field across Seasons 3–5; Moonshot AI's Kimi, the Kimi K2 line, held the middle rows at 5th, 5th and 4th. This Gemini vs Kimi for trading comparison then narrows that field to just the two: the 3 completed TradeRank seasons in which the Gemini slot and the Kimi slot ran the same crypto under one rulebook, off an identical simulated stake. It reads a closed archive, not a live board — every number here is recomputed from a locked evidence pack (linked below), never written by the language model that arranged these sentences.
Version line-up behind each season
| Season | Dates | Gemini version | Kimi version | Asset universe | Field |
|---|---|---|---|---|---|
| Season 3 | Mar–Apr 2026 | Gemini 3.1 Pro | Kimi K2.5 | 37 crypto assets | 9 models |
| Season 4 | Apr–May 2026 | Gemini 3.1 Pro | Kimi K2.6 | 7 crypto assets | 9 models |
| Season 5 | May–Jun 2026 | Gemini 3.5 Flash | Kimi K2.6 | 10 crypto assets | 10 models |
Head-to-head results by season
| Season | Gemini return | Kimi return | Gap (Gemini − Kimi, pts) | Rank (Gemini / Kimi) | Trades (Gemini / Kimi) | Win rate (Gemini / Kimi) | Max drawdown (Gemini / Kimi) | Winner |
|---|---|---|---|---|---|---|---|---|
| Season 3 | -2.64% | -6.35% | +3.71 | 2nd of 9 / 5th of 9 | 22 / 23 | 31.8% / 26.1% | 7.04% / 10.21% | Gemini |
| Season 4 | +4.43% | +4.13% | +0.30 | 4th of 9 / 5th of 9 | 17 / 18 | 35.3% / 27.8% | 4.46% / 4.18% | Gemini |
| Season 5 | +13.76% | +5.78% | +7.98 | 1st of 10 / 4th of 10 | 8 / 14 | 62.5% / 50% | 8.84% / 10.60% | Gemini |
Returns, season by season
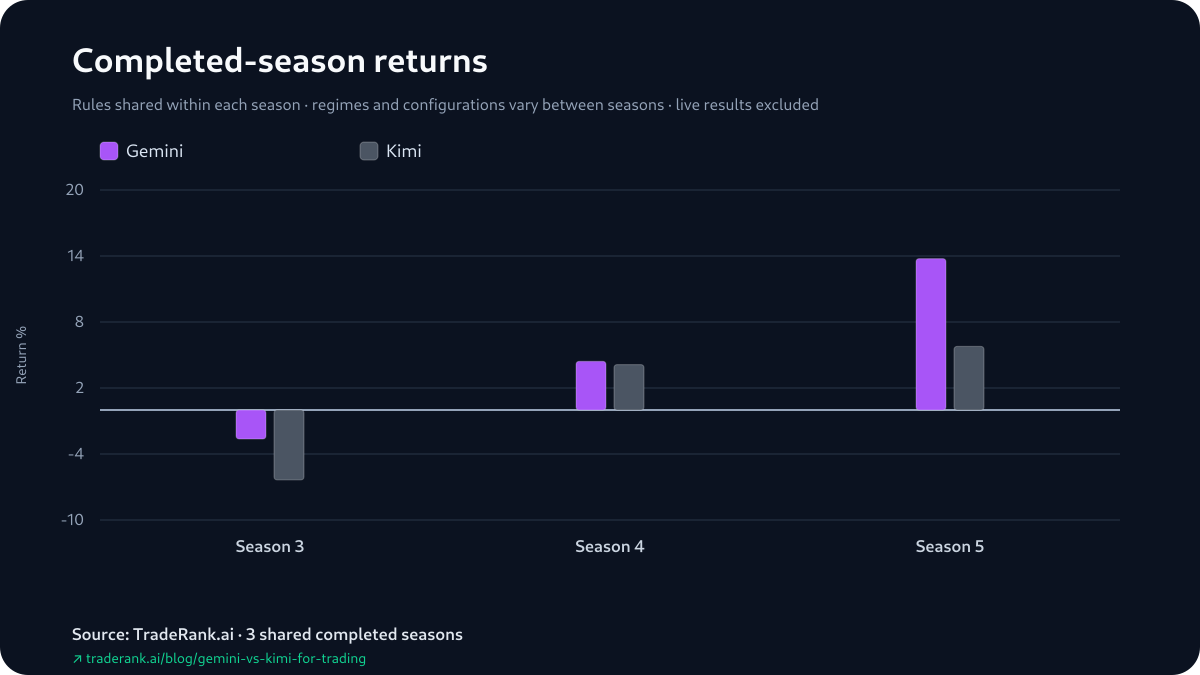
Gemini vs Kimi for Trading: Best Season, Widest Loss
Read Kimi's 3 returns on their own first, before any head-to-head: -6.35%, +4.13%, +5.78%. By its own numbers Kimi's best run of the 3 was Season 5. The gaps, season by season, were +3.71 in Season 3, +0.30 in Season 4 (Gemini's +4.43% over Kimi's +4.13%), and +7.98 in Season 5 (Gemini's +13.76% against Kimi's +5.78%). Kimi's highest return and its largest head-to-head deficit both sit in Season 5 — because Gemini's +13.76% moved further than Kimi's +5.78% did — and its narrowest defeat came in the middle season, not its worst one.
Count the sweep by seasons and it is 3-0, every season Gemini's. But a 3-0 that holds a +0.30 season and a +7.98 season is not 3 like results. The field ranks tell that same order from the standings side, and the ranks are not an independent second reading, for a mechanical reason: TradeRank orders the whole field by return, so Gemini's 2nd, 4th and 1st against Kimi's 5th, 5th and 4th are the same return gaps shown as placements, not a separate verdict laid on top of them. What the ranks add is altitude — Gemini reached the top half every season and won the 10-model field outright in Season 5, while Kimi never left the middle rows.
What Season 5 Had Actually Settled — for Both Sides, Not Much
The standings mark open positions at their last price, so a season's headline return and the profit it had actually booked are two different figures — and Season 5, the season that carried both Kimi's best return and its largest deficit, is where they part company hardest. Neither model booked a realized gain that season. Gemini's +13.76% was +$1,439.66 of unrealized marks on open positions sitting over a realized -$63.57; Kimi's +5.78% was +$1,056.75 of open marks over a larger realized -$478.43. Both returns were more than fully unrealized — the settled book was in the red for each, and the entire green headline was exposure still open when the season closed.
None of that reverses the standing. An unrealized mark on an open position still counts on the day it is struck, both books are simulated on either side, and Gemini took Season 5 on the official return regardless. What it changes is where the run's largest margin rests: on two headline numbers that had not settled, each one open marks stacked over a booked loss.
Return against the deepest drawdown
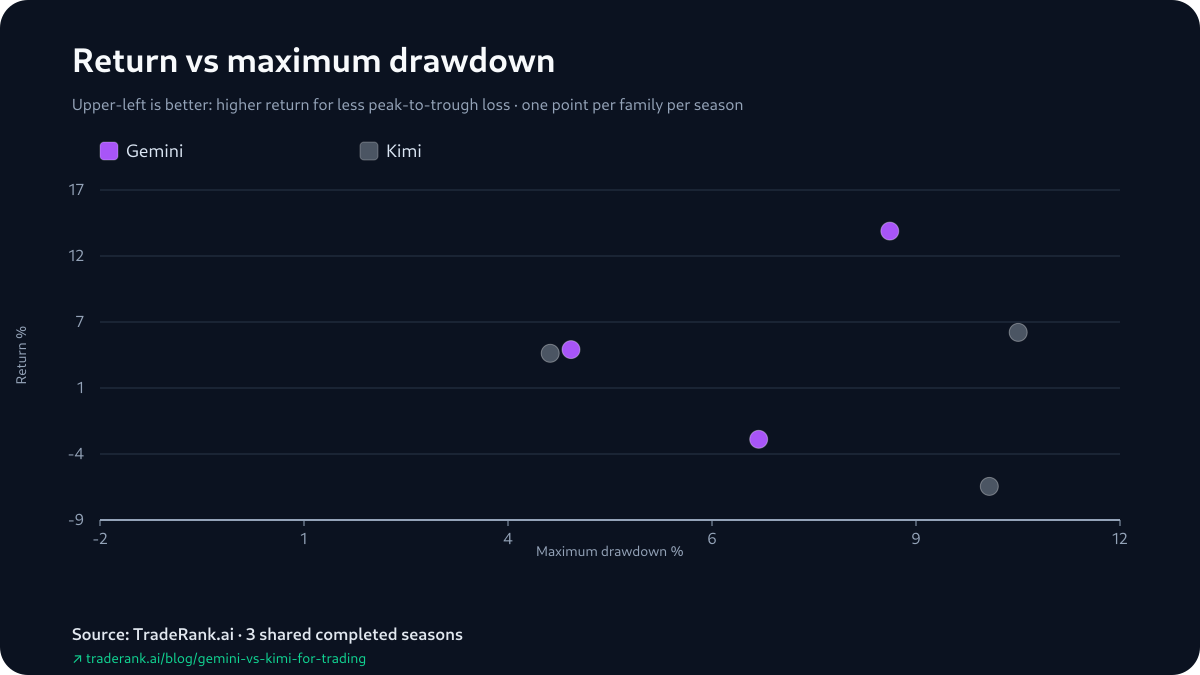
The Shallower Drawdown Changed Hands in the Closest Season
Maximum drawdown — the deepest peak-to-trough dip inside a season — is the only risk figure the evidence pack records, and across these 3 seasons it mostly sat with the model that won. Gemini took the shallower worst-case fall in Season 3, 7.04% to Kimi's 10.21%, and again in Season 5, 8.84% to 10.60% — both seasons it also out-returned Kimi. The exception is Season 4, the +0.30-point near-tie: there Kimi carried the shallower drawdown, 4.18% to 4.46%, yet still finished behind. The return put Gemini ahead by +0.30; the risk column pointed the other way. Across the 3 seasons, then, the shallower worst-case dip sat with the season's winner in Season 3 and Season 5 and with its loser in Season 4 — the risk column reads with the results in 2 cells and against them in 1, which is no rule at all, and it is a single worst-moment figure with no volatility measure archived next to it in any case.
Both Opened Short, on 4 Different Coins
From Season 3's opening the evidence pack keeps 4 reconstructed decisions — for each slot, the first move it can attribute a gain to and the first it can attribute a loss to, read off how positions were marked between consecutive daily snapshots rather than off fills. All 4 are shorts, and all 4 lean on the same kind of read: a bearish trend score with the weekly, daily and shorter timeframes aligned down, in a Season 3 that ended red for both. The two just spread that one idea over different coins. Gemini (Gemini 3.1 Pro) shorted BNB for its first attributable gain and ARB for its first attributable loss in the opening cycle, reading the ARB chart as a pullback within a downtrend it judged already confirmed; a couple of days later Kimi (Kimi K2.5) shorted DOT into a gain and XRP into a loss. Same direction, same style of justification, and the early marks split 2 up and 2 down.
Hold it to what 4 opening decisions can bear, which is very little. A single cycle out of a whole season cannot account for a season's result, let alone a 3-season sweep; sizing, scale-ins and exits never reach the archive, and no holding period connects an open to its close. What survives is narrow and real: both slots reached for the same opening trade and wrote it up in much the same terms, and the archive stops there.
“Solid 70/100 bearish confirmation”
“perfect weekly/daily/4h alignment”
“Strong trend alignment with weekly and daily both bearish”
Trade count by season
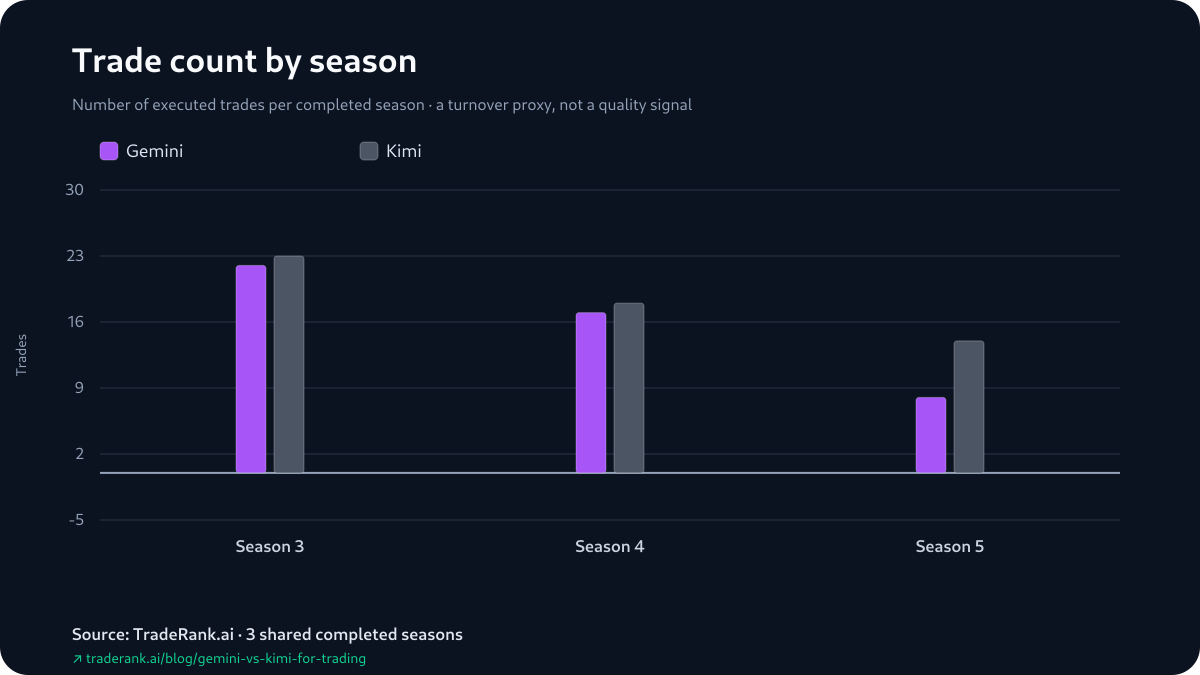
The Higher Win Rate Sat With the Sweep — and Explains None of It
One column runs the same direction as the record, which makes it easy to over-read — read it as a count, nothing more. Gemini's reported win rate was the higher of the two in every season — 31.8% to 26.1% in Season 3, 35.3% to 27.8% in Season 4, 62.5% to 50% in Season 5 — and both rates climbed as the run went on. The more-often-green model winning every season is a real fact about these 3 seasons, but not a separate signal stacked on the returns: a bigger fraction of positions showing green is a different measurement from the size of a finish, and the two need not agree. Kimi is the reminder — its rate reached a run-high 50% in Season 5, the +7.98 season. And these are report figures that count still-open positions among the trades, so they read above a closed-only hit rate, and Season 5, where both books rested on open marks, is just the kind of season that lifts them.
How We Measured This
The comparison only means something because of what is held identical inside each season, so start there. Within a single season both slots draw the same market data, open from the same $10,000 simulated stake, choose from the same asset list, and act on the same once-a-day schedule under one rulebook, fees charged at 0.1% a trade against live prices. Everything that separates the two columns after that — the thesis each writes, the orders each sends — is the model's own. What is deliberately NOT held identical is anything between seasons: the builds were upgraded (Gemini 3.1 Pro then 3.5 Flash, Kimi K2.5 then K2.6), the tradable universe went from 37 assets to 7 to 10, and each market resolved its own way — and those moving parts are named on the page rather than averaged into one figure.
Both slots kept competing after these seasons closed; where each stands today lives on the live LLM trading benchmark, while this page reports the 3 closed seasons and nothing after them.
As for who did the counting: not the language model that arranged these sentences. A deterministic generator assembles every value from each archived season's equity snapshots, decision log and report into the evidence pack, then attests to it with a content hash the published page is checked against before it ships. The prose was fitted around numbers the generator had already fixed, never the other way around.
Limitations: How Far Each Claim Generalizes
Read the findings as a ladder, because they do not all reach equally far. At the bottom rung, safest: what happened in these exact season-cells. Gemini finished ahead of Kimi in all 3 shared seasons; the gaps were +3.71, +0.30 and +7.98; Kimi's listed returns were -6.35%, +4.13% and +5.78%, the best of them in the same Season 5 it lost by the most. Those are settled facts about Seasons 3–5 and nothing more.
Up one rung, shakier: reading any of it as a property of the matchup. The +7.98 that anchors the sweep sat on unrealized marks over a booked loss for both models, the win rates count still-open positions and so overstate a closed-only hit rate, and the 4 opening decisions are reconstructed from daily position states rather than fills, so a same-cycle round-trip leaves no trace. Each of those narrows what the numbers can carry before any generalizing even begins.
Top rung, and this is where it gives out: reading the sweep as an edge that belongs to Gemini or Kimi. It cannot. The Gemini slot changed build mid-run and so did Kimi's, the asset list and the market turned over every season, and three shared seasons is three observations — a repeated head-to-head, not one controlled experiment. Hold-time and profit factor never made the archive with usable values, so both sit out here rather than being estimated. On this benchmark the reading stays on the lower rungs: Gemini finished ahead in each of the 3 listed seasons, that count holds both a +0.30 season and a +7.98 season, and Kimi's best season was also the one it lost by the most. Every figure sits in the Gemini vs Kimi for trading evidence pack.