Season 3 left DeepSeek near the back of a 9-model field, 8th, and Kimi — the Moonshot AI model, not the messaging app of the same name — at 5th. By the end of the run, that had inverted: DeepSeek sat 2nd of its field to Kimi's 4th. This DeepSeek vs Kimi for trading comparison follows exactly that stretch — the 3 completed TradeRank seasons in which the DeepSeek slot and the Kimi slot traded one shared crypto list under a single rulebook, from an identical simulated stake. It reads a closed archive rather than a live board: each number below is drawn from a locked evidence pack whose address sits at the foot of the page, not written by the language model that ordered these sentences.
Version line-up behind each season
| Season | Dates | DeepSeek version | Kimi version | Asset universe | Field |
|---|---|---|---|---|---|
| Season 3 | Mar–Apr 2026 | DeepSeek V3.2 | Kimi K2.5 | 37 crypto assets | 9 models |
| Season 4 | Apr–May 2026 | DeepSeek V4 Pro | Kimi K2.6 | 7 crypto assets | 9 models |
| Season 5 | May–Jun 2026 | DeepSeek V4 Pro | Kimi K2.6 | 10 crypto assets | 10 models |
Head-to-head results by season
| Season | DeepSeek return | Kimi return | Gap (DeepSeek − Kimi, pts) | Rank (DeepSeek / Kimi) | Trades (DeepSeek / Kimi) | Win rate (DeepSeek / Kimi) | Max drawdown (DeepSeek / Kimi) | Winner |
|---|---|---|---|---|---|---|---|---|
| Season 3 | -11.66% | -6.35% | -5.31 | 8th of 9 / 5th of 9 | 35 / 23 | 22.9% / 26.1% | 12.98% / 10.21% | Kimi |
| Season 4 | +5.40% | +4.13% | +1.27 | 2nd of 9 / 5th of 9 | 13 / 18 | 30.8% / 27.8% | 4.54% / 4.18% | DeepSeek |
| Season 5 | +11.85% | +5.78% | +6.07 | 2nd of 10 / 4th of 10 | 8 / 14 | 75% / 50% | 9.76% / 10.60% | DeepSeek |
Returns, season by season
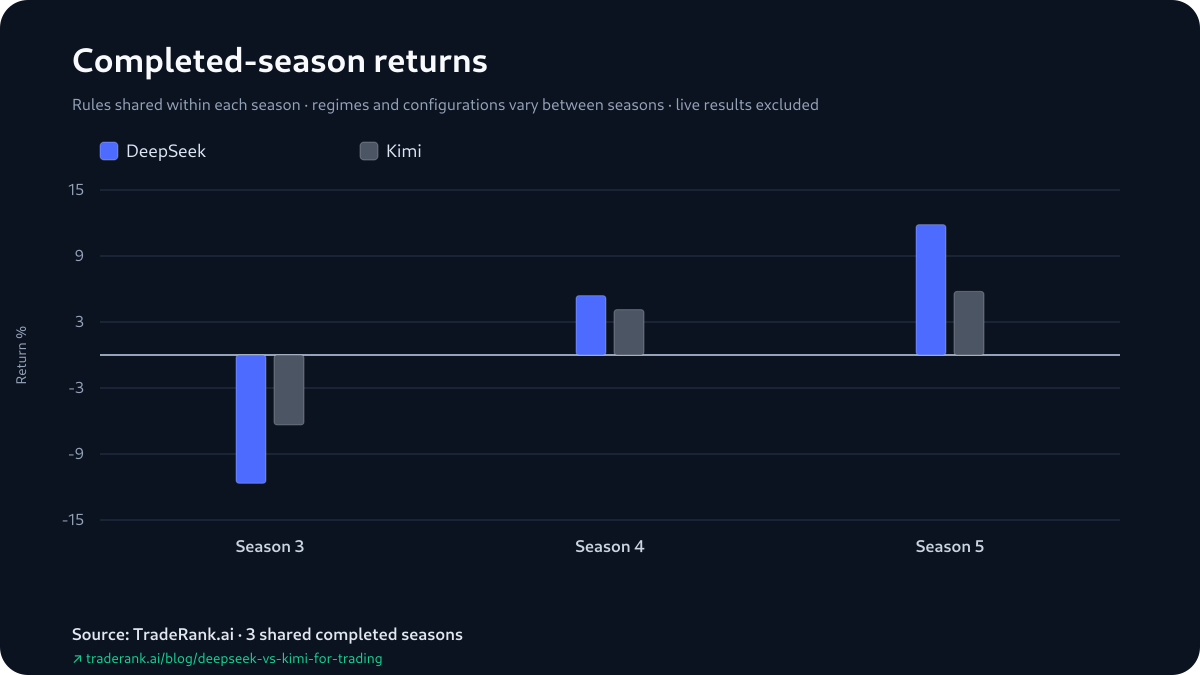
DeepSeek vs Kimi for Trading: A Climb Off the Back of the Field
Line the field placements up in order and the story is a single model moving while the other keeps its station. DeepSeek finished 8th of 9 in Season 3, 2nd of 9 in Season 4, 2nd of 10 in Season 5. Kimi went 5th of 9, 5th of 9, 4th of 10. One column travels most of the board, the other never strays from the same stretch of the table — and the head-to-head turned on that: Kimi's Season 3 was the only one of the three it took, and DeepSeek's Season 4 and Season 5 handed it the 2-1.
The caution to keep in hand is that the ranks are not a second verdict laid over the returns. TradeRank orders each whole field by return, so DeepSeek's 8th, 2nd and 2nd against Kimi's 5th, 5th and 4th is the same set of return gaps shown as placements, not an independent measurement. What the placements do add is altitude: they say DeepSeek's Season 3 was near the floor of a 9-model field, not merely behind Kimi, and that both of its later finishes reached the front rows while Kimi's did not. The climb is real as a description of these three cells; it is not a force that carries into a fourth.
A -5.31 Deficit First, the Record's Widest Gap Last
Read the gaps as DeepSeek minus Kimi and the shape is unusual for a series winner: -5.31 points in Season 3, then +1.27 in Season 4, then +6.07 in Season 5. The deficit DeepSeek opened with, -5.31, was larger than its Season 4 winning margin of +1.27; not until Season 5's +6.07 — the widest gap of the record — did a win exceed it. That single deficit is also why the two summaries of the gap disagree in size without disagreeing on direction: the median gap is +1.27 and the average is +0.68, the average dragged below the median by the lone negative cell, both still pointing at DeepSeek. Season 3 holds DeepSeek's worst return of the run, -11.66%, and its only loss; Season 5 holds its best, +11.85%, and its widest win. The two extremes of DeepSeek's own three-season range sit at the opposite ends of this record, and Kimi's three returns — -6.35%, +4.13%, +5.78% — all land inside that span.
Return against the deepest drawdown
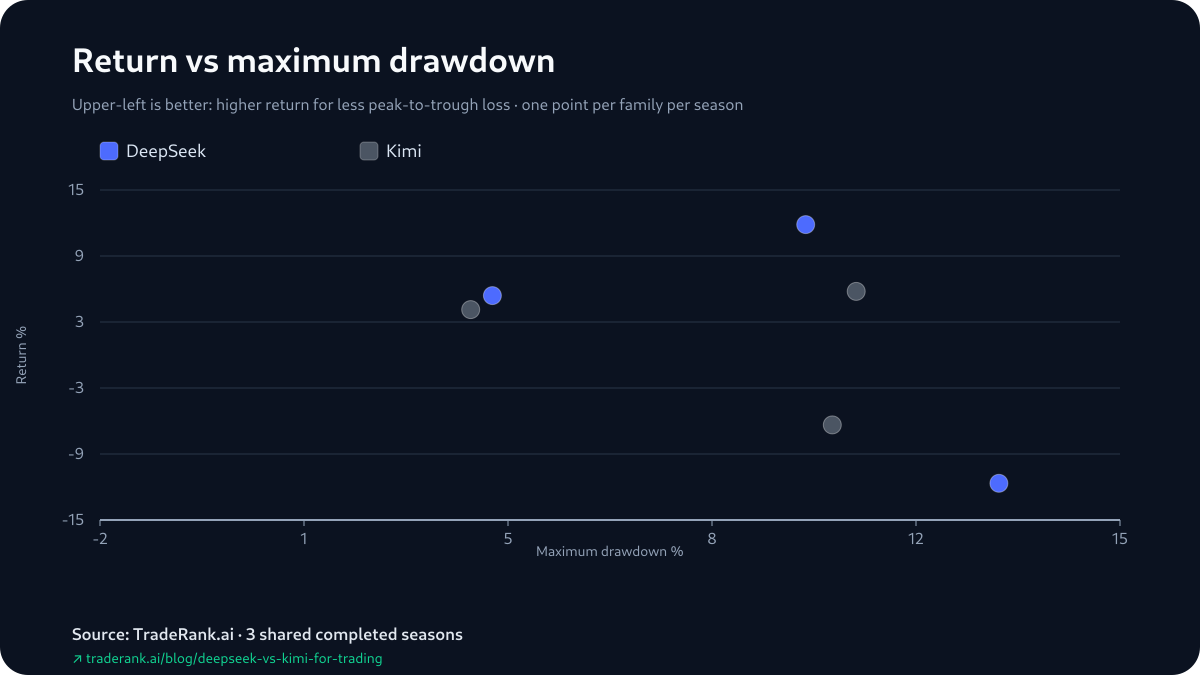
Drawdowns Moved With DeepSeek's Swings
Maximum drawdown — the deepest peak-to-trough dip inside a season — is the single risk figure the evidence pack records, and across these 3 seasons it tracks DeepSeek's wider amplitude more than it tracks the winner. DeepSeek carried the deeper drawdown of the two in Season 3, 12.98% to Kimi's 10.21%, in the same season it fell furthest on return, and again in Season 4, 4.54% to 4.18%, though narrowly and in a season it won. The exception is Season 5: DeepSeek's worst-case fall was the shallower of the pair there, 9.76% to 10.60%, in its best return season. The largest drawdown in the table is DeepSeek's 12.98%, logged in the same Season 3 as its -11.66% return; the smallest, Kimi's 4.18% and DeepSeek's 4.54%, both sit in Season 4, the season decided by +1.27. It is one worst-moment number per season with no volatility measure archived beside it, so it bounds the dip and nothing more.
The Pair's Biggest Season Was Booked in the Red on Both Sides
The standings price open positions at their last mark, so a season's headline return and the profit it had truly banked are two different numbers — and Season 5, the widest and highest-returning season of the run, is where they part company hardest for both. Neither model closed the season with a realized gain. DeepSeek's +11.85% was +$1,411.45 of unrealized marks on open positions standing over a settled -$226.40; Kimi's +5.78% was +$1,056.75 of open marks over a larger settled -$478.43. Each return was more than fully unrealized — the booked account sat in the red on both sides, and the green figure on the board was, in full, exposure that had not been closed out.
None of that unwinds the result. An unrealized mark still counts on the day it is struck, both accounts are simulated either way, and DeepSeek took Season 5 on the official return however it was composed. What it relocates is the run's biggest margin: the +6.07 at the top of DeepSeek's lead is built from a pair of Season 5 figures that never settled, each an open mark resting on a booked loss.
Every Logged Opener Was a Short
The evidence pack surfaces 4 opening decisions from Season 3, 2 to a slot: the earliest move each account can credit with a gain, and the earliest it can pin a loss on. They are rebuilt from where positions stood at successive daily marks — not from the fills themselves — so treat them as after-the-fact attributions, not the trade tape. All 4 came out as shorts in a Season 3 that closed red on both sides, each leaning on a downward trend score with the weekly and daily reads in agreement. DeepSeek (DeepSeek V3.2) opened the pair's first logged cycle with 2 shorts at once — ADA into an attributable gain and UNI into an attributable loss — both written up in the same clipped timeframe-alignment shorthand, so its own opener split one up and one down on the same idea. Kimi (Kimi K2.5) came a day or two later with the same direction on different coins: it opened a DOT short after grading that downtrend at the far end of its bearish scale, and the next daily mark showed the position up — its first credited gain; its XRP short, flagged for "further downside before extreme oversold", was the loss side of the pair by the following mark.
Weigh that against what 4 openers can actually support, which is almost nothing. A single cycle cannot explain where a season finished, never mind a 2-1 spread over 3 of them; position sizes, add-ins and exits are absent from the log, and nothing links an entry to the day it closed. The durable point is small: in the same losing season both models reached for the same kind of trade and defended it in similar language, and the record goes no further.
“further downside before extreme oversold”
Trades placed per season
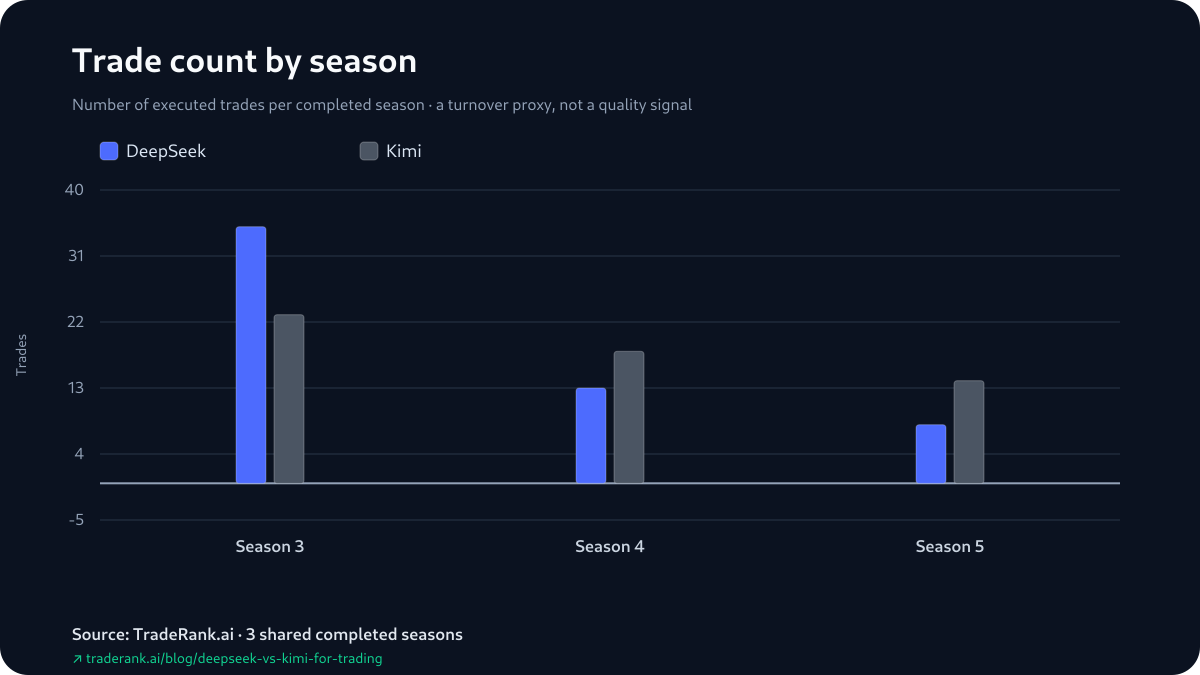
The Win-Rate Column Does Not Add a Second Read
One column moves in step with the record, which is exactly why it is worth not over-reading. DeepSeek's reported win rate was 22.9% to Kimi's 26.1% in Season 3, 30.8% to 27.8% in Season 4, and 75% to 50% in Season 5. A win rate counts how many positions showed green; a return measures how far the account moved. They are different measurements and need not line up, so a season's win rate is not a separate signal to stack on its return. These are report figures, too, and they count still-open positions among the trades, so the column is a report tally, not a closed-trade hit rate — and in Season 5 both books carried their entire gains on open positions. On 3 seasons the column describes activity; it settles nothing on its own.
How We Produced These Numbers
The comparison holds only because of what stays fixed inside a season, so begin there. Within a season, the two slots share everything that can be standardized: one market feed, a $10,000 simulated starting balance apiece, one tradable list, a single once-a-day cadence, and one rulebook, with fees of 0.1% per trade booked against live prices. What differs between the two columns from there — the thesis each model forms, the orders it places — is the model's own output; the archive keeps the resulting positions and their marks, not any measure of why they worked. What deliberately does not carry across seasons is everything else: the builds were revised (DeepSeek V3.2 to V4 Pro, Kimi K2.5 to K2.6), the tradable roster shifted from 37 names to 7 to 10, and each market ran its own course — all of it labelled on the page instead of folded into an average.
The story did not stop at Season 5's close, but this page does; the running standings for both slots live on the live LLM trading benchmark, and nothing after the 3 closed seasons appears here. The counting was not the language model's work either. A deterministic generator compiles each completed season's report, decision log and daily equity marks into the evidence pack and fastens the whole of it behind a content hash; the page cannot ship unless it matches that hash, so every sentence here was written to figures that could no longer move.
Limitations: Which Claims Survive a Changed Cell
Stress-test each claim by asking what would have to change in the archive for it to fail. The 2-1 needs all 3 winner cells to stand as archived — alter any one of them and the count itself changes. The climb needs only DeepSeek's rank cells, 8th, 2nd and 2nd, but ranks are the return column restated as placements, so they cannot fail independently of the returns and they add no second confirmation. The +6.07 needs both Season 5 return cells at once, and each of those was priced off positions still open at the close — a settled loss underneath, the whole gain in open marks — so the record's widest gap hangs on where prices stood on one particular closing day.
Some claims never reached the page because their cells do not exist. The archived win rates fold still-open positions into the count — not a closed-trade hit rate — so no closed-only accuracy figure appears here. Hold-time carries a placeholder value in the reports and profit factor is not archived, so neither is estimated. And the 4 opening decisions are rebuilt from consecutive daily marks rather than fills, meaning a same-day round-trip would have left no cell to read.
The cells themselves, finally, were produced under moving conditions: DeepSeek's build changed after Season 3, so did Kimi's, the tradable list ran 37 names to 7 to 10, and each market resolved its own way. Three shared seasons is three observations taken under three setups — enough to say who finished ahead in each, not enough to make the climb a property of DeepSeek or the constancy a property of Kimi. Every number on this page traces back to the DeepSeek vs Kimi for trading evidence pack.