This page is a join of two archives. On one side sits the Anthropic slot's completed-season record; on the other, the MiniMax slot's — and a Claude vs MiniMax for trading comparison exists only where those two records overlap. They overlap on Seasons 3–5, the 3 completed TradeRank seasons in which Claude Opus 4.6, then Claude Opus 4.7, and MiniMax M2.5, then MiniMax M2.7, traded the same crypto under one rulebook off an identical simulated stake. It is not TradeRank's whole completed-season history — only the seasons the two shared. Every figure below is recreated from a locked evidence pack, linked at the end, and none of it was written by a language model; when a season closes, the pack regenerates and this page is re-derived from it.
Season line-up: the builds behind each result
| Season | Dates | Claude version | MiniMax version | Asset universe | Field |
|---|---|---|---|---|---|
| Season 3 | Mar–Apr 2026 | Claude Opus 4.6 | MiniMax M2.5 | 37 crypto assets | 9 models |
| Season 4 | Apr–May 2026 | Claude Opus 4.7 | MiniMax M2.7 | 7 crypto assets | 9 models |
| Season 5 | May–Jun 2026 | Claude Opus 4.7 | MiniMax M2.7 | 10 crypto assets | 10 models |
Head-to-head results by season
| Season | Claude return | MiniMax return | Gap (Claude−MiniMax, pts) | Rank (Claude / MiniMax) | Trades (Claude / MiniMax) | Win rate (Claude / MiniMax) | Max drawdown (Claude / MiniMax) | Winner |
|---|---|---|---|---|---|---|---|---|
| Season 3 | -7.61% | -0.63% | -6.97 | 6th of 9 / 1st of 9 | 24 / 10 | 8.3% / 20.0% | 8.82% / 4.11% | MiniMax |
| Season 4 | +0.88% | +6.94% | -6.06 | 8th of 9 / 1st of 9 | 12 / 9 | 25.0% / 55.6% | 3.64% / 2.45% | MiniMax |
| Season 5 | +2.67% | -8.05% | +10.72 | 6th of 10 / 10th of 10 | 13 / 8 | 69.2% / 37.5% | 11.69% / 8.90% | Claude |
Returns, season by season
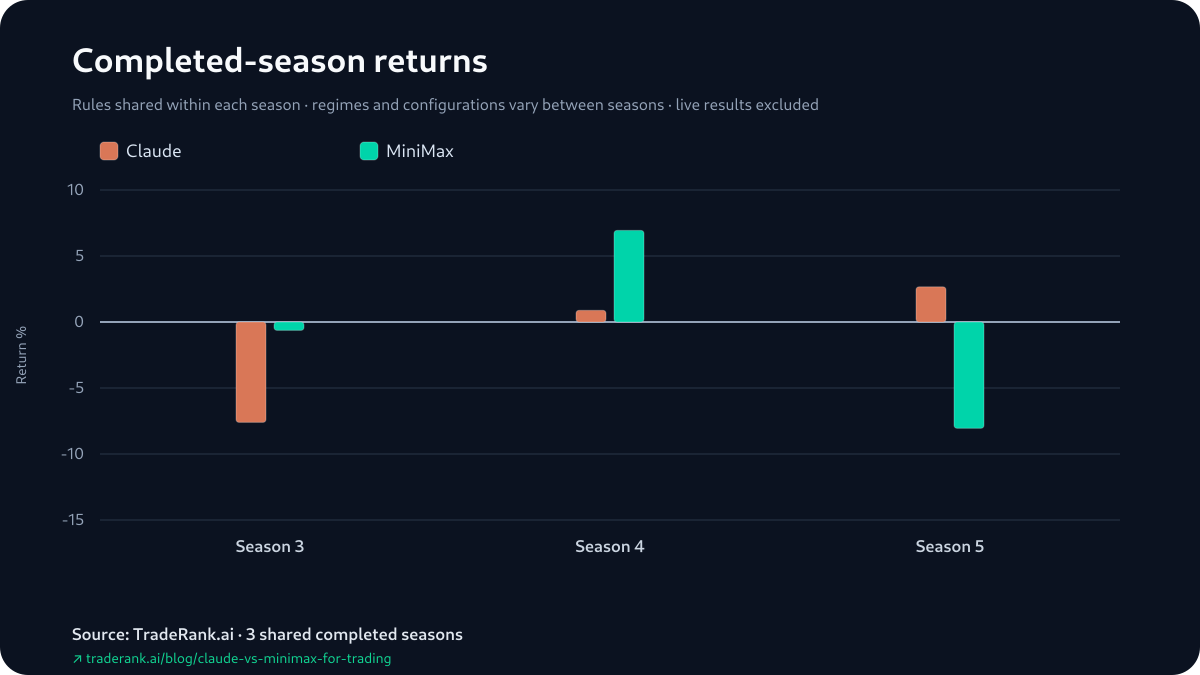
Claude vs MiniMax for Trading: A 2-1 That Never Ran Close
The open contest is elsewhere: the live LLM trading benchmark tracks where these two slots trade next, while this page stays put as the settled seasons behind that view. Read the 3 seasons in order. MiniMax took Season 3, when the field finished down, at -0.63% to Claude's -7.61% — a gap of -6.97, every gap on this page measured as Claude minus MiniMax. It took Season 4 as well, +6.94% to +0.88%, a gap of -6.06. Claude answered in Season 5, +2.67% to MiniMax's -8.05%, a gap of +10.72 the other way. Counted as season wins, MiniMax was ahead after Season 3, further ahead after Season 4, and still ahead after Claude's Season 5 win closed it to 2-1 — a lead set at the opener rather than built at the end, and one MiniMax never gave back.
One feature of those 3 margins: none of them was close. The narrowest was Season 4's -6.06 and the widest Season 5's +10.72, with Season 3's -6.97 in between — the count settled at 2-1, but no single season ran close. The median gap is -6.06 and the average -0.77, 2 compressions of the same 3 gaps: the median sits with MiniMax while the average lands near zero, pulled there by Claude's lone +10.72 nearly cancelling the two negative gaps — near-zero on average even though no single season was near-zero on the day. And the rank column is not an extra check: TradeRank ranks the whole field by return, so 6th of 9 against 1st of 9 restates the same return order in the context of the field, not an independent count.
Winner on Return, Winner on the Realized Book
Season standings mark open positions at their live prices, so a headline return and a settled book are separate questions — and in this pair every season gave the same name to both. Season by season, the return winner and the realized-P&L winner were one and the same model, realized P&L being the booked component the pack carries apart from the open marks. MiniMax's Season 3 was the best line in a losing field: a realized -$50.40 and -$12.99 in open marks, -$63.39 in all, against Claude's realized -$720.16 beneath -$40.52 unrealized, -$760.69 total. Its Season 4 win was clean on both books — a realized +$447.24 under +$246.69 of open marks, +$693.93 — while Claude booked a realized -$369.85 that +$458.12 of open marks lifted to a +$88.27 total. Then Claude's Season 5: a realized +$324.41 with -$57.40 of open marks against it, +$267.01 in all, over MiniMax's realized -$846.45 that +$41.13 of open marks barely softened, -$805.32 total.
3 seasons, 3 shapes — positive on both books, positive-realized-under-negative-marks, negative on both — and under each, one ordering: the model leading the total led the settled portion too. That is not a second scoreboard or a separate verdict. Realized P&L is a timing fact about what had closed by the final day, and both accounts are simulated on either side. What it settles is narrow and specific to this pair: the open-position marks, which can swing a headline return on their own, never tipped a season to the model that booked less. On a 3-season sample, that is a coincidence worth recording, not a property either name carries forward.
Return against maximum drawdown
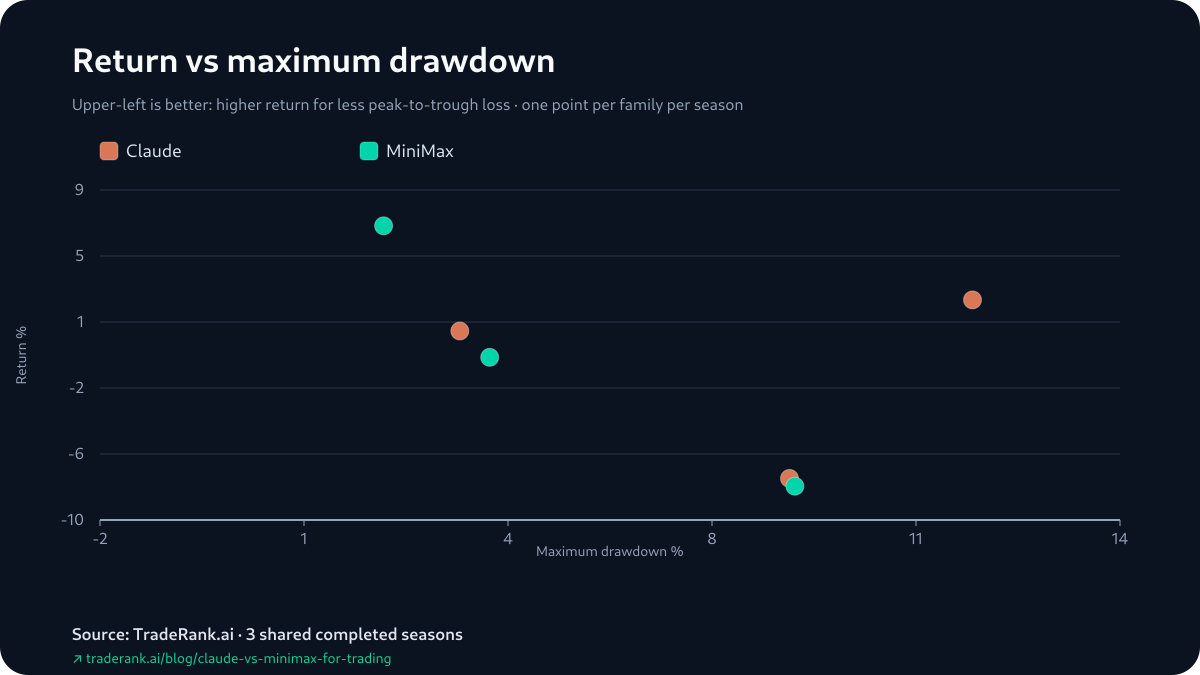
Claude's Best Return Came With Its Deepest Drawdown
Drawdown is the pack's one risk measure — the largest peak-to-trough fall within a season — and it does not sort this pair. Claude's ran 8.82%, then 3.64%, then 11.69% across the 3 seasons, out of step with its returns of -7.61%, +0.88% and +2.67%: its best return, Season 5's +2.67%, sat over its deepest fall of the three, 11.69%. And in that same Season 5, Claude carried the deeper drawdown of the two — 11.69% against MiniMax's 8.90% — and still took the head-to-head, while in the 2 seasons MiniMax won it had also fallen less, 4.11% to Claude's 8.82% and 2.45% to 3.64%. So which model dipped deeper decided none of the 3 results. Maximum drawdown is one worst-moment figure, the pack logs no volatility field beside it, and on 3 heterogeneous seasons it describes the sample rather than a durable risk edge for either name.
Two Opening Shorts, One Mark to the Cent
From Season 3 the pack keeps four opening decisions — for each slot, its first attributable gain and its first attributable loss — every one rebuilt from how a position was marked across consecutive daily snapshots, never from a fill. Both slots' first attributable gain lands on the same trade: a short on ADA opened in Season 3's first cycle, about a minute apart. The pack marks both at the same next-snapshot figure, +$1.91 — same-asset shorts read over the same daily window — and it does not say why the marks match; the record stops at the two entries and their marks, so treat the identical cent figure as a coincidence of the archive, not something to build on. Their first attributable losses then part: Claude's on a short of UNI in that opening cycle, MiniMax's on a short of ETH opened a few days later, each marked down by its next snapshot.
Hold it to what four decisions out of a whole season allow, which is very little. The pack logs the entries and their next-snapshot marks, but no position size, no adds or trims, no hold-time — so a same-cycle round-trip is invisible and the weeks that actually set each season's return are off the record. What is here is a footnote of the archive, not a season: two opening shorts on the same coin, carrying the same next-snapshot mark, and no more.
Trade count by season
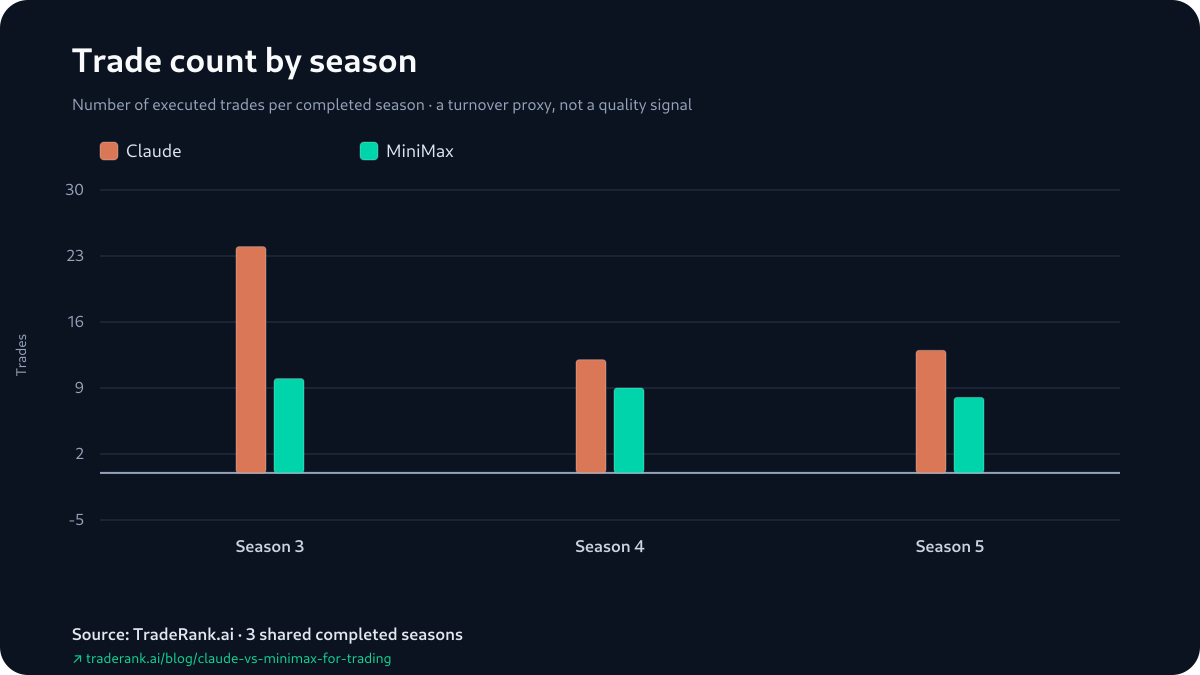
Claude Traded More Every Season, and It Settled Nothing
Claude placed more trades than MiniMax in each of the 3 seasons — 24 to 10, 12 to 9, 13 to 8 — and the head-to-head ran the other way, 2-1 to MiniMax. The longer book was Claude's throughout, yet it took only Season 5, so raw activity did not track the result here. Claude's own count roughly halved after Season 3, 24 down to 12, then 13; MiniMax's sat at 10, 9, 8. On 3 seasons, with the asset list and the market changing under each, read the counts as description, not a habit of either model.
A Word on the Win-Rate Column
The win-rate cells invite a tidier story than they can support, so read them plainly and with their asterisk attached. For Claude and MiniMax they run 8.3% to 20.0% in Season 3, 25.0% to 55.6% in Season 4, and 69.2% to 37.5% in Season 5 — Claude's 8.3% in Season 3, the lowest cell in the table, sits in a season it lost, and its 69.2% in Season 5 in the one it won. But these come straight from the season reports, which count any position still open at the close among the trades, so they are not closed-only hit rates — and a larger share of positions marked green can still weigh less than fewer, heavier losers. Take the column as one more measurement with its own caveat, not a second read on who finished ahead.
How We Read the Pair
Every number here has a moment it was read, and naming those moments is most of the method. Each season's figures are taken once, at the close: the standings mark open positions at their last price that day, which is why the realized and unrealized halves are carried apart rather than merged, and why a headline return and a booked profit can differ. Inside a season the two are matched — Claude and MiniMax get the same market feed, an identical $10,000 simulated bankroll, the same tradable list and one daily decision window, with a modeled 0.1% fee per trade and live prices throughout; from there each writes its own thesis and sends its own orders. Between seasons nothing is held: the builds were upgraded, the tradable list ran 37 names, then 7, then 10, and the market resolved differently each time — the axes this 3-season record is read across, named on the page instead of averaged away.
As for who did the counting, it was not a language model. A deterministic generator walks each completed season's equity snapshots, decision log and report, and recreates the pair's record inside the evidence pack, where a content hash covers every value; before this page ships, it is double-checked against that hash. The prose was arranged around numbers the generator had already fixed, never the other way around.
Limitations: What Was Measured, and What It Means
The measurements here are exact; what they mean is where the sample runs out, so keep the two apart. Measured cleanly: 3 completed seasons of returns, ranks, drawdowns, trade counts, win rates and the realized/unrealized split, each recreated from the archive to the cent. What that can mean is thin. The organizing fact — return winner and realized-P&L winner matching in all 3 seasons — is a co-occurrence on 3 observations, not a mechanism; one more season could hand the return win and the realized lead to different names, with no update to either model required for it.
Under that sit the narrower measurement limits. Because a return values open positions at their last price, a season's headline and the part of it that had actually settled are two figures — which is why the split is broken out per season. The win-rate cells count still-open positions among the trades, as the season reports do, so they are not closed-trade hit rates. The four opening decisions are read from how each position moved between daily snapshots, not from fills, so anything opened and closed inside a single cycle leaves no mark, and a season-end open is a live mark, not a settlement. The prompts, the builds, the tradable list and the market each turned over from season to season, which is what makes this a repeated matchup instead of a controlled experiment — 'Claude' stands for 2 builds here and so does 'MiniMax'. Hold-time and profit factor have no trustworthy value in the archive, so the page drops them rather than guessing.
So where does the pair land? MiniMax holds the head-to-head 2-1; the season gaps ran -6.97, -6.06, then +10.72, none of them close; and each season's return win came with the realized lead attached. A fourth season is the only thing that moves that, and it is being played out on the live LLM trading benchmark. Every figure sits in the Claude vs MiniMax for trading evidence pack: 3 shared seasons, 2 builds a side, each number above traceable to a locked cell.