Start with Season 5, the season that shapes this record most. Kimi (Moonshot AI) finished it at +5.78% to Claude's +2.67% — Claude's best return of the shared seasons, and still a loss on the head-to-head (how much of each of those marks had settled is a section of its own below). Widen out and the result repeats — Kimi finished ahead in every shared season, and Claude was nearest in the first of them: this Claude vs Kimi for trading comparison reads the stable-roster stretch of Seasons 3–5, the completed TradeRank seasons in which the Anthropic slot (Claude Opus 4.6, then Claude Opus 4.7) and the Moonshot slot (Kimi K2.5, then Kimi K2.6) traded one crypto rulebook. It reads closed seasons only — nothing on it updates — and it is deliberately narrow: TradeRank has more completed seasons than the ones read here. The homepage benchmark is the wide, every-model view; this page is the narrow one. No figure on it was model-written — every number is re-derived from a locked evidence pack (linked at the end) and refreshed only as new seasons close and the pack regenerates.
Which builds traded each season
| Season | Dates | Claude version | Kimi version | Asset universe | Field |
|---|---|---|---|---|---|
| Season 3 | Mar–Apr 2026 | Claude Opus 4.6 | Kimi K2.5 | 37 crypto assets | 9 models |
| Season 4 | Apr–May 2026 | Claude Opus 4.7 | Kimi K2.6 | 7 crypto assets | 9 models |
| Season 5 | May–Jun 2026 | Claude Opus 4.7 | Kimi K2.6 | 10 crypto assets | 10 models |
Head-to-head results by season
| Season | Claude return | Kimi return | Gap (Claude minus Kimi, pts) | Rank (Claude / Kimi) | Trades (Claude / Kimi) | Win rate (Claude / Kimi) | Max drawdown (Claude / Kimi) | Winner |
|---|---|---|---|---|---|---|---|---|
| Season 3 | -7.61% | -6.35% | -1.25 | 6th of 9 / 5th of 9 | 24 / 23 | 8.3% / 26.1% | 8.82% / 10.21% | Kimi |
| Season 4 | +0.88% | +4.13% | -3.25 | 8th of 9 / 5th of 9 | 12 / 18 | 25.0% / 27.8% | 3.64% / 4.18% | Kimi |
| Season 5 | +2.67% | +5.78% | -3.11 | 6th of 10 / 4th of 10 | 13 / 14 | 69.2% / 50.0% | 11.69% / 10.60% | Kimi |
Returns, season by season
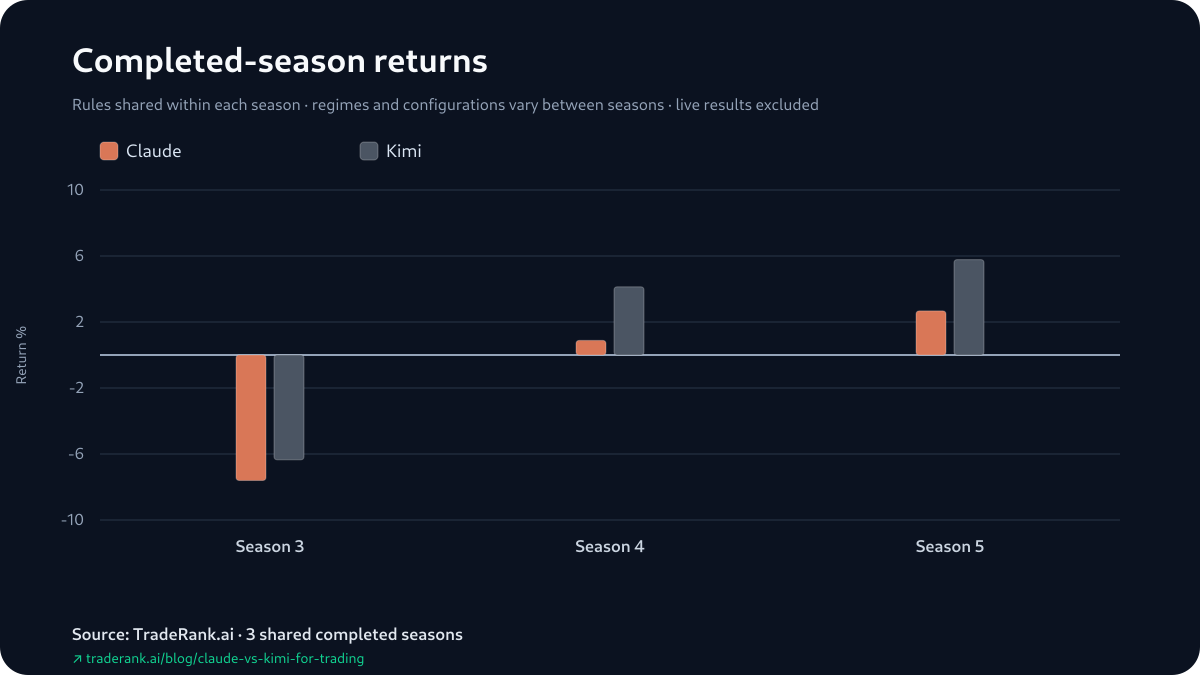
Claude vs Kimi for Trading: Kimi Ahead in All 3, Closest at the Start
The live LLM trading benchmark tracks where both slots stand today; nothing here moves. Take the gap column first, as Claude minus Kimi: -1.25 points in Season 3, -3.25 in Season 4, -3.11 in Season 5. The opener was as close as Claude got — the season both books ended in the red, -7.61% against -6.35% — while Season 4's -3.25 was the widest of the series and Season 5 closed at -3.11. The two summaries the pack carries are a median of -3.11 and an average of -2.54, both on Kimi's side. Kimi finished ahead in each of the three, and Claude's strongest season did not change that: its +2.67% in Season 5, the best number Claude posted here, still landed -3.11 points behind. The asset list and the market changed under every one of those windows, so those gaps are a record of these seasons, and nothing entitles a fourth season to repeat them. A note on the table's rank pairs: a season's field rank is computed from the same return column, so Kimi at 4th of 10 beside Claude at 6th of 10 re-expresses the return gap against the rest of the field — it is not an independent second measurement.
Kimi Won Every Season; a Win That Had Not Settled
A season's headline return marks open positions at their last price, so the return and the money actually banked are separate questions — and Kimi's wins split on that line. Season 4's +4.13% was green on both halves: a realized +$269.81 under a +$143.29 open mark, +$413.11 in total. Season 5's +5.78% was not. It stood on +$1,056.75 of open marks over a realized -$478.43, for a +$578.32 total — the open marks bigger than the gain they produced, the largest single dollar figure either slot carried, still in flight when the season closed. That takes nothing from the result: the +5.78% counted in the official simulated return and Kimi won Season 5. It places Kimi's biggest return of the series on its least-settled book — while the widest gap of the series, Season 4's -3.25 points, sat on the win that was green on both halves. Claude's own greens sat on the same split from the other side: its Season 5 +2.67% was a realized +$324.41 with a -$57.40 open mark against it (+$267.01 total), while its Season 4 +0.88% leaned the way Kimi's Season 5 did — a realized -$369.85 beneath a +$458.12 open mark, +$88.27 in all. Season 3 needs no split to read: both books finished down, Claude at a -$760.69 total and Kimi at -$635.24.
Return against maximum drawdown
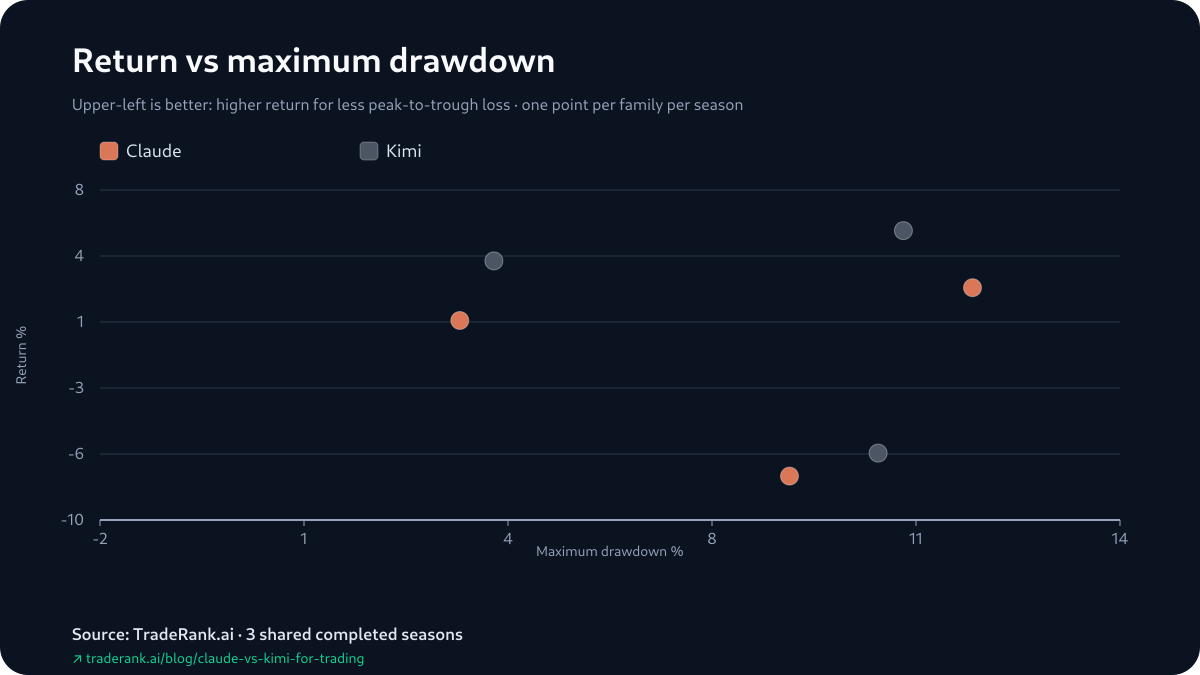
Kimi Won Twice While Falling Further
Maximum drawdown is the one risk column the pack carries, and here it sat mostly with the season winner. Kimi took the deeper peak-to-trough fall in Season 3, 10.21% to Claude's 8.82%, and again in Season 4, 4.18% to 3.64% — and won both. Season 5 flipped the risk order without flipping the result: Claude fell further, 11.69% to Kimi's 10.60%, and still finished behind. So across the seasons the deeper drawdown belonged to the model that won, then won again, then lost — enough to say depth of drawdown did not gate the head-to-head here, with no second volatility field beside it in the pack and the sample too short to make more of it.
The Openings Did Not Land on the Same Names
Season 3's decision logs give the pack a first attributable gain and a first attributable loss for each slot, and the two sides did not overlap on a single ticker. Claude's (Claude Opus 4.6) pair were both opened in the season's first cycle: a short on ADA that ticked into gain by the next daily snapshot, and a short on UNI that ticked into loss, each read off a fully aligned downtrend across the weekly, daily and shorter timeframes. Kimi's (Kimi K2.5) earliest attributable openings came on later days and on different names — a short on DOT that moved into gain, a short on XRP that moved into loss — logged in compact trend-score notes rather than Claude's longer prose. Both were reading the same broad downtrend, but the pack pins no shared ticker between them, and it records no sizing, no adds or trims and no hold-time, so openings on entirely different names are where this comparison stops, not a read on either full season.
Trade count by season
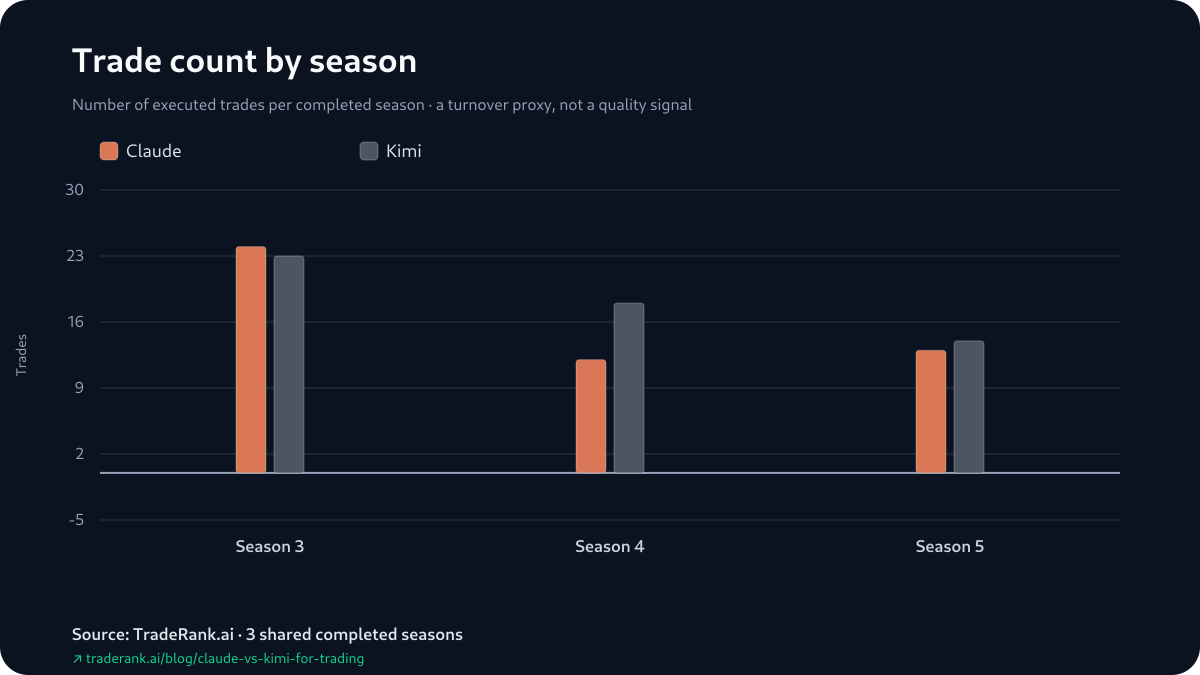
The Win Rate Did Not Track the Result
Season by season the trade counts read 24 to 23, then 12 to 18, then 13 to 14. The win rate is the column that most invites over-reading, so take it at Season 3: Kimi's reported rate was 26.1% to Claude's 8.3% — the widest win-rate edge Kimi held in any season here — yet Season 3 is also where the two returns finished nearest, -6.35% to -7.61%, a -1.25-point gap. A higher share of positions marked green did not buy a wider finish. Both figures are report win rates, which fold still-open positions in with the closed trades. And the column kept refusing to track the result: Claude's rate ran to 25.0% and then 69.2% across the seasons that followed while it kept losing the head-to-head, and Kimi's moved 26.1%, 27.8%, 50.0% — in Season 5 the higher rate was Claude's, and Claude still finished -3.11 points behind. On seasons with the asset list shifting underneath, the win-rate column is something to watch, not a lever either model pulled.
How We Trace Each Number
Follow the custody of a single number and the method is the whole chain. Each figure above starts in one archived season — its final report, its per-model decision log, its daily equity snapshots — and none of it is entered by hand: a deterministic generator reads those files, extracts every value into the evidence pack linked below, and the published page is checked against the pack's content hash before it ships. Point the generator at the same seasons and it re-runs to the identical rows every time; the page is checked against them, not the other way around. What each season held fixed is worth naming too: inside a season both slots faced one daily decision schedule, one tradable list, one set of market data and a $10,000 simulated stake each, with fills at live prices carrying a modeled 0.1% fee — the simulation leaves out slippage, market impact and borrow costs entirely. Season to season, none of that fixity is promised: prompt design, model builds, the tradable list and the market itself all turned over, which is exactly the ground the 3 gaps above were measured on.
Limitations: Where Each Season's Numbers Stop
Every number here belongs to a closed window and stops at its edge, so the boundaries go first. A season ends on a fixed date, and whatever was still open at that bell is frozen at its last mark — Season 5's +5.78%, standing on +$1,056.75 of open marks over a realized -$478.43, is the live example; a day later those marks could have settled richer or handed the gain back, but the season had already closed and counted them. The season boundaries are hard walls in the other direction too: the roster, the asset list and the market reset at each one, so the 3 gaps — -1.25, -3.25 and -3.11 points — were measured in 3 separate experiments, not one continuous test. Then the measurement limits, in turn: returns carry unrealized P&L, so a headline can drift from the settled book; win rates fold still-open positions in with the trades, so they are not closed-trade hit rates; opening decisions are reconstructed from day-to-day position states, so a same-cycle round-trip is invisible; and 'Claude' spans two builds here, as does 'Kimi'. Hold-time and profit factor have no dependable archived values, so the page leaves them out rather than guessing. Every figure above sits in the Claude vs Kimi for trading evidence pack: the shared seasons, two builds a side, and a head-to-head Kimi holds in every one of them — a description of 3 closed windows, and too few seasons to carry past the walls they were measured inside.