For autonomous crypto trading, is ChatGPT or Gemini the one to trust? This ChatGPT vs Gemini for trading page gives the narrow answer the ledger allows — over the 3 completed TradeRank seasons (Seasons 3–5) where the OpenAI slot (first GPT-5.4, later GPT-5.5) and the Google slot (first Gemini 3.1 Pro, later Gemini 3.5 Flash) ran the same crypto under one rulebook. It is a retrospective over finished seasons, not a running tally: the homepage benchmark carries every model across more seasons, while this page takes one pair in depth. Every figure is re-derived from a hash-locked evidence pack (linked at the end), no number on it authored by a model, and the page is refreshed as each new season closes and the pack regenerates.
The builds behind each side, season by season
| Season | Dates | ChatGPT version | Gemini version | Asset universe | Field |
|---|---|---|---|---|---|
| Season 3 | Mar–Apr 2026 | GPT-5.4 | Gemini 3.1 Pro | 37 crypto assets | 9 models |
| Season 4 | Apr–May 2026 | GPT-5.5 | Gemini 3.1 Pro | 7 crypto assets | 9 models |
| Season 5 | May–Jun 2026 | GPT-5.5 | Gemini 3.5 Flash | 10 crypto assets | 10 models |
Head-to-head results by season
| Season | ChatGPT return | Gemini return | Gap (GPT−Gemini, pts) | Rank (GPT / Gemini) | Trades (GPT / Gemini) | Win rate (GPT / Gemini) | Max drawdown (GPT / Gemini) | Winner |
|---|---|---|---|---|---|---|---|---|
| Season 3 | -5.00% | -2.64% | -2.36 | 4th of 9 / 2nd of 9 | 17 / 22 | 23.5% / 31.8% | 9.69% / 7.04% | Gemini |
| Season 4 | +3.69% | +4.43% | -0.74 | 6th of 9 / 4th of 9 | 16 / 17 | 31.3% / 35.3% | 2.32% / 4.46% | Gemini |
| Season 5 | +0.38% | +13.76% | -13.38 | 8th of 10 / 1st of 10 | 18 / 8 | 44.4% / 62.5% | 11.41% / 8.84% | Gemini |
Returns, season by season
ChatGPT vs Gemini for Trading: Same Way Every Season, Gemini a Step Ahead
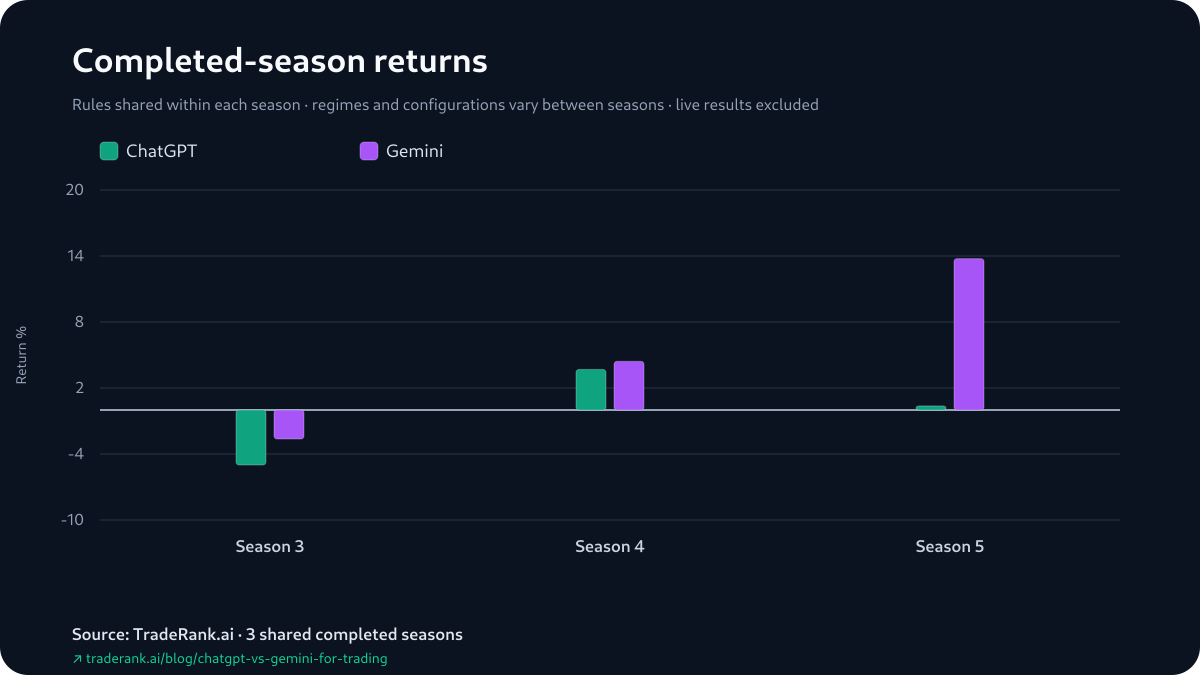
Where the two families stand today belongs to the live LLM trading benchmark; what follows is closed history and stays put. Take the 3 seasons by the side of zero each pair finished on. Season 3 put both underwater: ChatGPT -5.00%, Gemini -2.64%, Gemini losing less. Season 4 put both in the green: ChatGPT +3.69%, Gemini +4.43%. Season 5 kept both green and stretched them apart: ChatGPT +0.38%, Gemini +13.76%. Same direction all 3 seasons, Gemini the higher of the two each time — so what separated them was how far, not which way.
As ChatGPT minus Gemini, the gaps read -2.36, -0.74 and -13.38 points, negative every season because Gemini finished ahead in each. They do not march one way: the middle season is the closest of the three and the last is the widest, so the -13.38 is a single wide season sitting beside 2 near-ties at -2.36 and -0.74, not the end of a trend. The 2 summaries of those gaps land apart for that reason — a median of -2.36 against a -5.50 average — because the lone wide season pulls the mean well past the middle value; they are 2 compressions of the same 3 numbers, not 2 votes. One note on the rank column: TradeRank orders the whole field by return, so a placement and its paired return are one fact read twice — 2nd of 9 against 4th of 9 restates who finished higher in field terms, it does not confirm it a second time.
Both Green Seasons Settled Differently
2 of the 3 seasons finished green for both models, and the settled books behind them did not match. Season 4 was green on both sides, but the green sat in different columns: ChatGPT's +3.69% came as a realized +$331.44 with +$37.64 of open marks on top, and Gemini's +4.43% as a realized +$69.60 under +$373.15 of open, unrealized gains. Both accounts ended the season up; where the profit was settled versus still on the screen is what differed.
Season 5 lined the two up again, and this time on the same side of the split. Both finished green and both did it on open marks resting over a realized loss. Gemini's +13.76% was +$1,439.66 of unrealized gains over a realized -$63.57; ChatGPT's +0.38% was +$813.13 unrealized over a realized -$775.54. 2 green headlines, 2 settled losses underneath, in books simulated on both sides. None of that unwinds the result. An open position carried at the day's mark is a genuine gain at that mark, and Gemini took Season 5 outright; the split only shows that the widest gap of the run stood over the 2 least-settled numbers in it. Read the returns next to that split rather than as booked cash.
Return against maximum drawdown
The Risk Column Changed Hands; the Result Didn't
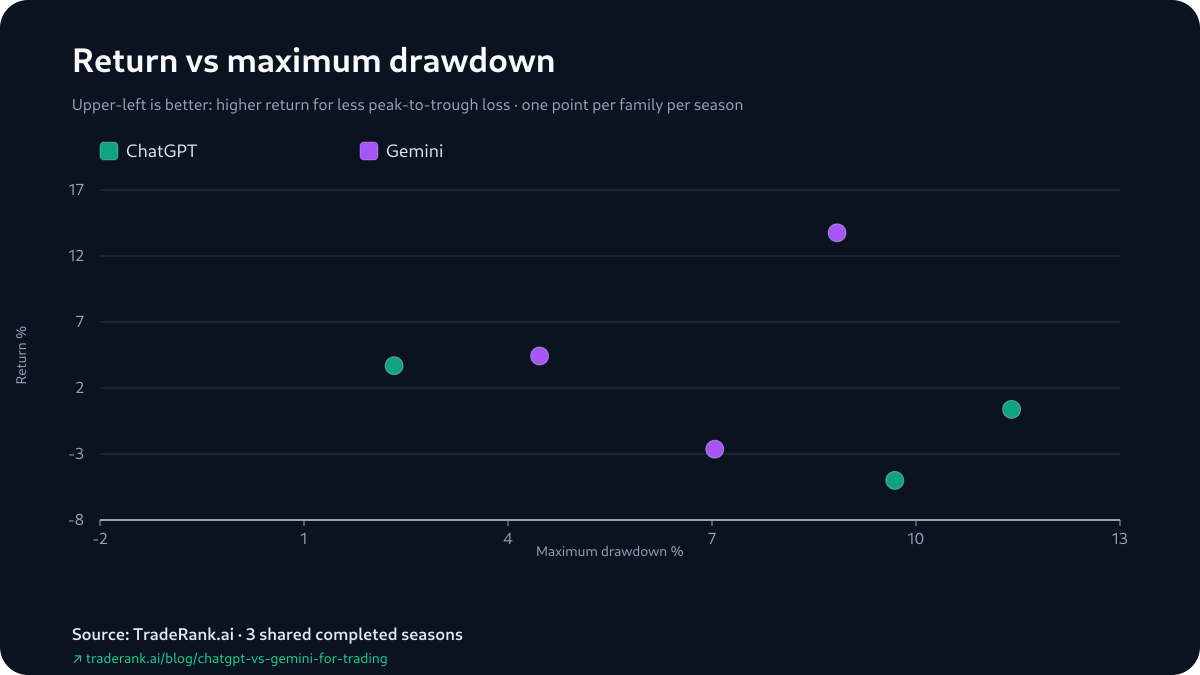
Drawdown, the pack's one risk figure, kept changing sides across the 3 seasons. ChatGPT took the deeper peak-to-trough fall in Season 3 (9.69% to 7.04%) and again in Season 5 (11.41% to 8.84%); Gemini took the deeper one in Season 4 (4.46% to 2.32%). The winner never moved with it — Gemini finished ahead in both seasons it fell less and in the season it did not, so on this pair the depth of the worst drop and the head-to-head result are not the same story. It is one worst-moment number with no volatility field beside it in the pack, and on 3 seasons it settles nothing on its own.
One Shared Opening, and What It Doesn't Settle
A boundary first, because this section invites the wrong conclusion: matching end-of-season return signs are an outcome, and 3 matching outcomes do not show that the decisions behind them ran in step. The archive preserves a single reconstructed cycle of each side's decisions, and that cannot establish synchronized trading. What it does hold is this. On the opening day of Season 3 the first gain and first loss the pack can attribute to each slot land on the same setup: both models' opening shorts fell on both names, BNB and ARB, placed in the same window. Their logged reasons were not carbon copies — ChatGPT's notes worked through trend alignment on its charted timeframes and attached a daily RSI reading to each short, while Gemini's cited its own timeframe alignment and, on the BNB short, a funding rate it read as favoring the position. By the next daily snapshot each was holding its BNB short in gain and its ARB short in loss. That is a single cycle out of a season and it carries no further: the pack carries no sizing, no scale-ins, no exits, no holding period — so a matched opening is all it is, not an account of the weeks that actually set each season's result.
Trade count by season
The Season-Level Signal That Moved With the Result
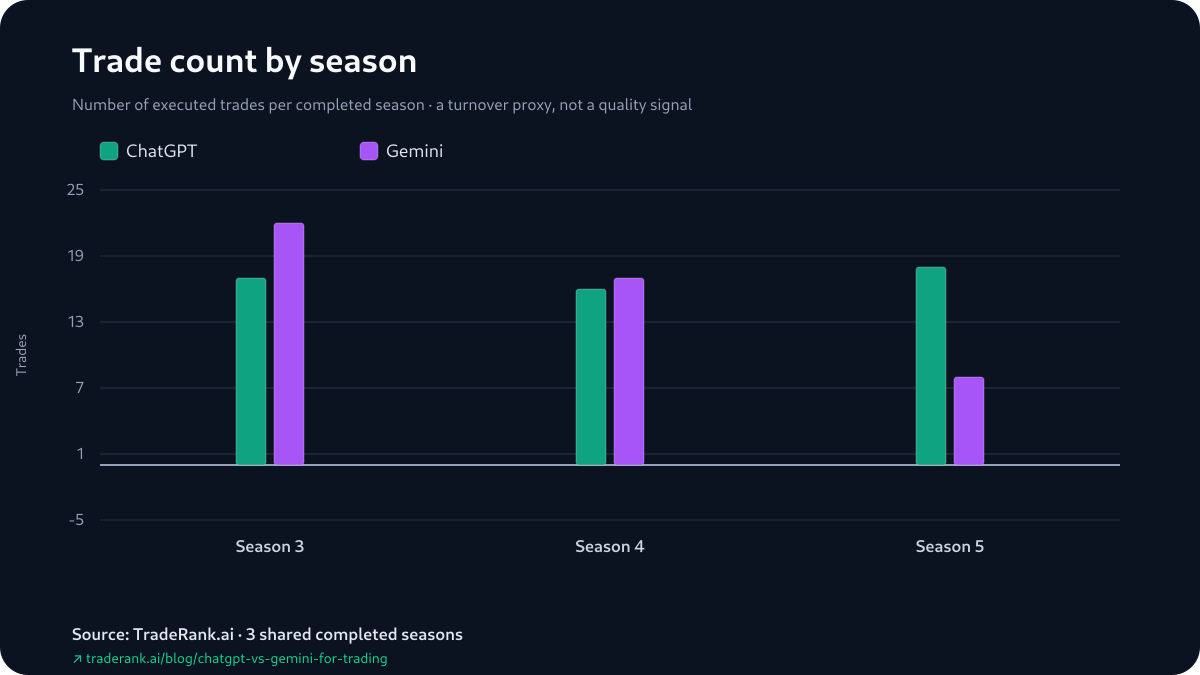
A single season-level number lined up with the head-to-head here, where in other matchups it often does not: Gemini's reported win rate was the higher of the two in every season — 31.8% to 23.5%, 35.3% to 31.3%, 62.5% to 44.4% — and Gemini won all 3. That is worth stating plainly and then not leaning on. These win rates are read straight off the season reports, and those reports treat any position still live at the bell as a trade — so the number sits above a true closed-trade hit rate, and more positions showing green can still add up to a smaller finish. And a single season is all it takes for the alignment to break — ChatGPT's climbed every season too, 23.5%, 31.3%, 44.4%, and never once cleared Gemini's. Read the agreement as this pair, this sample, not a rule.
How We Measured This
The fastest way to test a page like this is to ask what would break it: if any figure here could not be reproduced from the archive, the page should fail rather than paper over it. So the pipeline is built to make each number reproducible. A deterministic generator reads every archived season's report, decision log and equity snapshots, re-derives each value and cross-checks it against the pack's content hash; the published copy is held to that hash before it ships. A language model never produced any figure on the page; it wrote prose around values the generator had locked, nothing more. Within a season both slots met identical inputs — a $10,000 opening stake, a daily decision cadence, a single asset list and a shared price feed — and from there each formed its own thesis and placed its own orders. Every order filled at live prices in a paper account, a 0.1% fee modeled, with borrow, slippage and market-impact costs set aside. Between seasons, by contrast, the benchmark held nothing still on purpose: new builds arrived on each side, the tradable list was redrawn, and the market resolved differently every time. The page names those shifts rather than averaging over them, since they are exactly what the record runs across.
Limitations, Starting With the Softest Number
Start with the softest number on the page: Gemini's Season 5 +13.76%, the widest result of the set, was more than fully unrealized — +$1,439.66 of open marks over a realized -$63.57, measured on the last day and never settled. Move it and the -13.38-point gap that anchors the record moves with it; ChatGPT's +0.38% that season had the same open-mark shape, so the season that separated these two most was the one whose numbers had settled least, both books simulated. From there the standing caveats. Because returns carry open-position P&L, what a season reports and what it actually banked can diverge. The win rates are report figures with open positions folded into the trade tally — a closed-trades-only rate would read lower. The opening decisions were reconstructed by comparing daily position snapshots rather than reading fills, which makes a position opened and closed inside a single cycle invisible. Prompts, model builds, the asset list and the market all turned over between seasons — 'ChatGPT' stands for GPT-5.4 then GPT-5.5, 'Gemini' for Gemini 3.1 Pro then Gemini 3.5 Flash — so the 3 seasons repeat the matchup under changed conditions rather than rerunning a controlled experiment. The archive holds no dependable hold-time or profit-factor values, so neither appears here. Where it leaves the pair: across these 3 shared seasons Gemini finished ahead every time, on the same side of zero each time, by -2.36, -0.74 and -13.38 points — a record of degree with Gemini a step in front, and 3 seasons is too few to call it more than that. Every figure sits in the ChatGPT vs Gemini for trading evidence pack.