Hold the 2 rank pairs of this Mistral vs GLM for trading record next to each other: 3rd and 9th in Season 5, then 9th and 2nd in Season 6 — with Mistral owning the high spot first and GLM owning it second. The GLM initials on this page belong to Zhipu AI's (Z.ai's) model line — search engines often surface the Golem token for the same letters. It faced Mistral Medium 3.5 as GLM-5.1 and then GLM-5.2 across Seasons 5–6, the only completed TradeRank seasons the pair shares. Within each season the 2 slots drew identical conditions — one crypto list, one daily decision slot, a simulated $10,000 apiece — and every figure below traces into the generated evidence pack linked at the page's end.
Which versions traded each season
| Season | Dates | Mistral version | GLM version | Asset universe | Field |
|---|---|---|---|---|---|
| Season 5 | May–Jun 2026 | Mistral Medium 3.5 | GLM-5.1 | 10 crypto assets | 10 models |
| Season 6 | Jun–Jul 2026 | Mistral Medium 3.5 | GLM-5.2 | 10 crypto assets | 11 models |
Head-to-head results by season
| Season | Mistral return | GLM return | Gap (Mistral − GLM, pts) | Rank (Mistral / GLM) | Trades (Mistral / GLM) | Win rate (Mistral / GLM) | Max drawdown (Mistral / GLM) | Winner |
|---|---|---|---|---|---|---|---|---|
| Season 5 | +9.55% | -1.90% | +11.45 | 3rd of 10 / 9th of 10 | 6 / 23 | 83.3% / 39.1% | 7.94% / 7.45% | Mistral |
| Season 6 | -2.95% | +1.59% | -4.71 | 9th of 11 / 2nd of 11 | 8 / 15 | 25% / 33.3% | 6.24% / 8.51% | GLM |
Returns, season by season
The Mistral vs GLM for Trading Swap, Cell by Cell
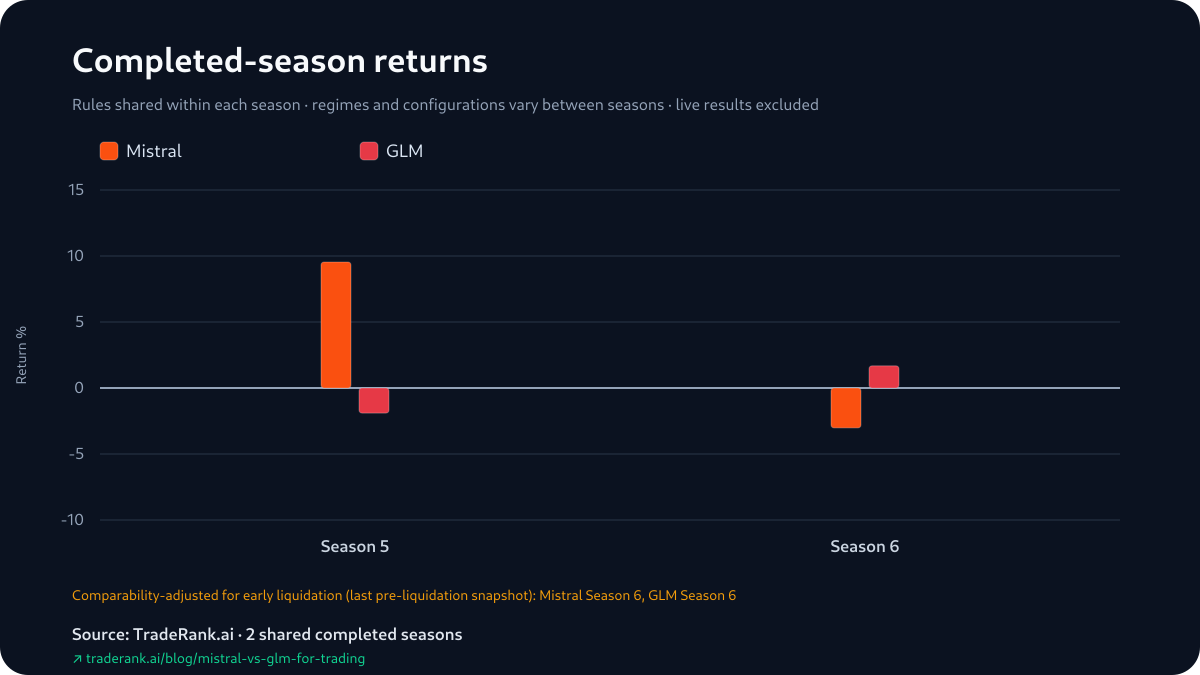
Read the 2 seasons as before-and-after frames. Before: Mistral 3rd of 10 at +9.55%, profitable on both books; GLM 9th of 10 at -1.90%, its 23 orders — the highest count either model posted in this record — producing a realized -$488.16 partly cushioned by +$297.85 in open marks. After: GLM 2nd of 11 at +1.59% official with +$177.93 settled — in a season where a modest green number placed near the top of the field — and Mistral 9th of 11 at -2.95%, its loss nearly all realized. The 9th-place slot did not go empty; it changed tenants.
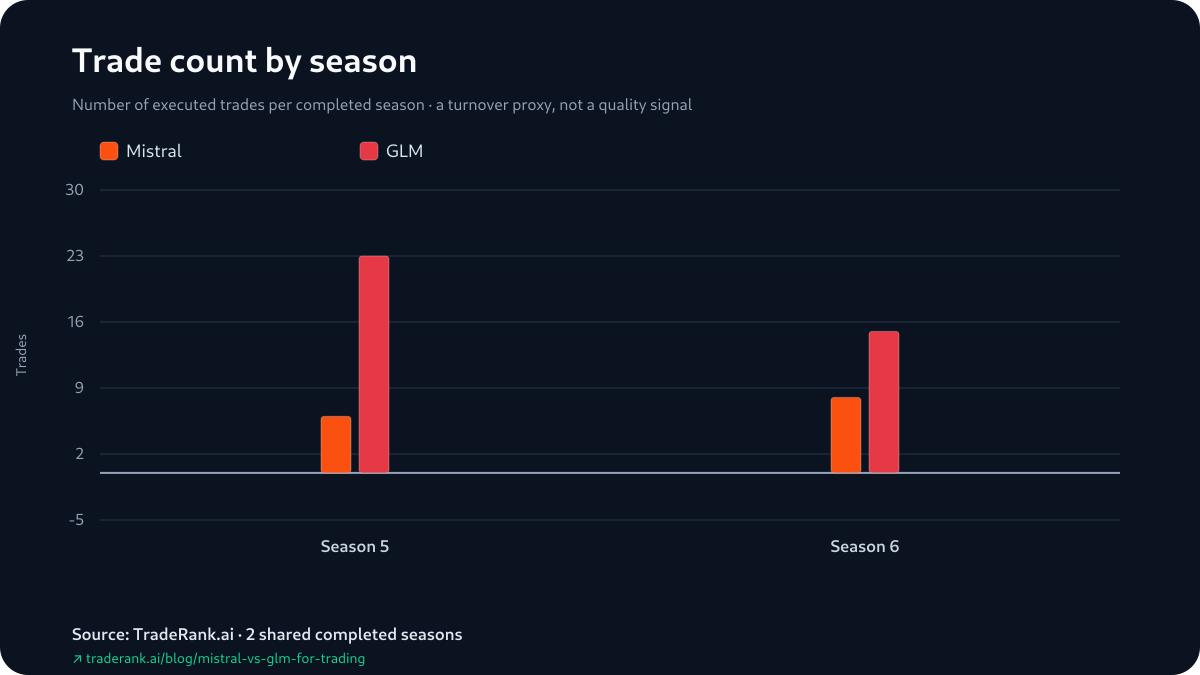
What did not swap is as notable. Mistral's order count stayed at 6 and then 8, win or lose, while GLM's fell from 23 to 15 as its fortunes rose — though with a new build and a mid-season prompt change arriving together, the record cannot say what mattered. The running score for this pair updates on the live LLM trading benchmark; this page stays with the completed frames.
Each season's return against its deepest drawdown
The Dip Column Ran With the Winner
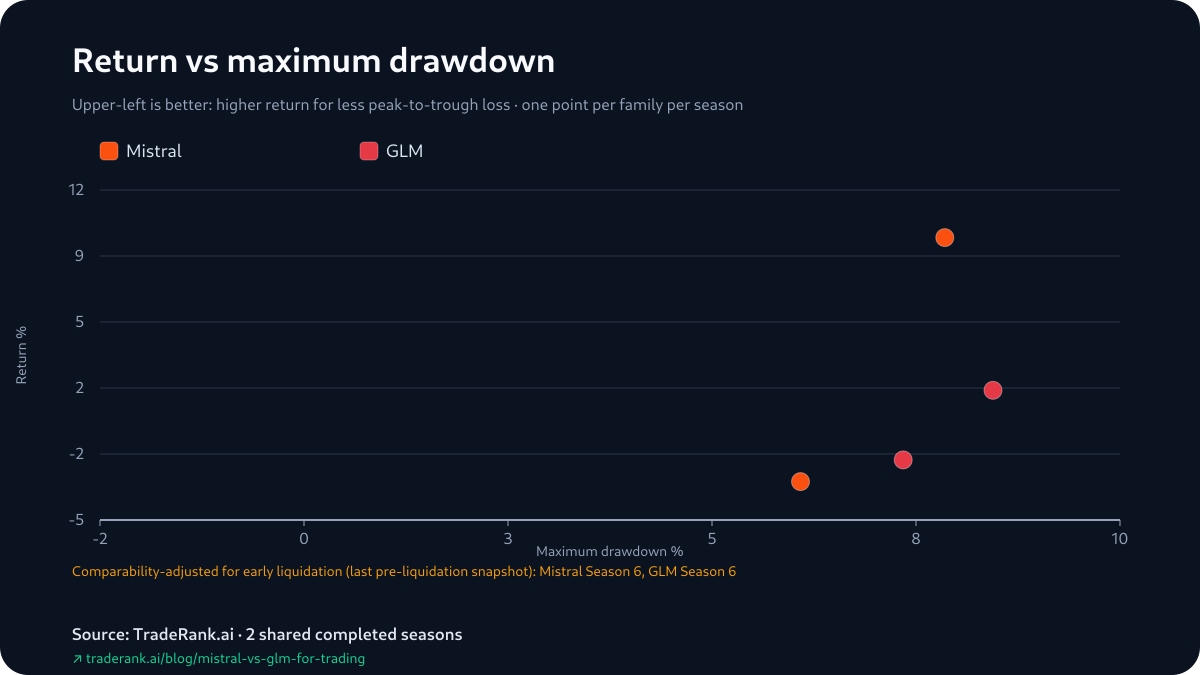
In both seasons, the account that dipped deeper also finished ahead. Season 5's winner was Mistral, at a 7.94% worst fall against GLM's 7.45%; Season 6's winner was GLM, at 8.51% against Mistral's 6.24%. Whatever a reader hopes maximum drawdown will do — flag the safer account, warn off the eventual loser — this pair's 4 cells do the opposite twice.
Read that alignment as 2 cells of coincidence until proven otherwise. Maximum drawdown is the pack's lone risk figure, one worst moment per account per season read from the same equity path as the return, and a 2-season run of deeper-dip-wins supports no safety conclusion in either direction — least of all the inverted one.
The Same First Trade, Logged Twice
Season 5's opening cycle produced a clean coincidence: Mistral and GLM opened the identical position within the same cycle. Both went long TRX; both logged it as a filter's sole survivor. GLM's (GLM-5.1) entry reads "Only tradeable asset with weekly▲ and daily▲ agreement" — flagging its overbought daily RSI and capping its own confidence — while Mistral's log noted that "4h confirms bullish bias" on the same single-qualifier read. By each model's next daily snapshot, both TRX longs were marked up: the same first trade, the same first result.
From that shared starting point the accounts diverged completely — 3rd against 9th by season's end. The pack's remaining attributable decisions mark the divergence's other bookend: GLM's first marked loss was an ETH short from that same opening cycle (one leg of a book that would run to 23 orders), while Mistral's did not arrive until a mid-June DOGE short. Snapshot reconstructions, as ever: no sizes, no exits, and no ability to explain the 11.45 points that grew between 2 accounts that began in the same place.
Trade count by season
How We Measured the Swap Without Moving the Yardstick
A place-swap claim is only as good as the constancy of the scoring, so here is what held: in both seasons, ranks are field positions ordered by official season return, computed the same way for every model, and the pair's returns come from the same standings files as everyone else's. What changed between the seasons is disclosed rather than smoothed over — 11 models instead of 10, GLM-5.2 instead of GLM-5.1, a prompt regime that moved mid-Season 6 to a medium-term investor framing, a universe an era note shows widening toward US equities mid-season, and a season-ending forced liquidation in Season 6 only. That last difference is why the pack scores Season 6's gap on pre-liquidation comparability figures — GLM +1.68%, Mistral -3.02% — while the table shows official returns; the winner is GLM on either basis.
Inside each season both slots got the standard rig: the shared 10-asset crypto list, one decision per day, live prices, modeled 0.1% fees, no slippage or borrow charges. And the standard guarantee stands behind every number: a deterministic generator registers each figure in the evidence pack beneath a content hash, the built page is re-read against the pack before shipping, and the model that wrote these sentences supplied none of the arithmetic.
Limitations: A Symmetry With 2 Data Points Inside It
The place-swap is this page's organizing image, and it should also be its first caveat: symmetry is aesthetically persuasive and statistically empty at this sample size. Each trajectory is 2 field positions; the swap is 2 seasons' worth of coincidence until more seasons say otherwise. The GLM that won Season 6 (GLM-5.2) is not the build that lost Season 5, so the 'GLM climbed' framing quietly spans a version boundary. Season 5's green side leaned on marks — Mistral's +9.55% held +$774.47 open over +$180.39 realized — while GLM's Season 6 win was the settled kind, +$177.93 banked after the liquidation, so the 2 wins are not even the same species of result without the pack's comparability adjustment. Win rates (83.3% and 39.1%, then 25% and 33.3%) count open positions throughout. And the shared first trade, memorable as it is, is one attributable decision per model out of seasons that contained dozens. The Mistral vs GLM evidence pack carries every cell above at full precision, ready for the third season to be added.