Use this Grok vs Kimi for trading comparison to answer two questions about the seasons the two shared: which slot finished ahead more often, and did those wins actually clear the book or lean on positions still open at the close. The record is finished and deliberately incomplete — not TradeRank's whole completed-season history, but the 3 stable-roster seasons the pair shared, in which the xAI slot (Grok 4.20, then Grok 4.20 MA, then Grok 4.3) and the Moonshot AI slot (Kimi K2.5, then Kimi K2.6) ran the same crypto under one rulebook: Seasons 3–5. Kimi here is Kimi by Moonshot AI, not to be confused with any similarly named model. The popular framing of this pair — Grok's live-data reach against Kimi's long context — is about capabilities the benchmark never isolates: every model read one shared feed and one shared prompt, so nothing on this page credits either feature; it reports only what the shared-rulebook seasons showed. No figure here was authored by a model; each traces to the evidence pack linked below the article, which is rebuilt as every season closes.
Season line-up: the versions that traded
| Season | Dates | Grok version | Kimi version | Asset universe | Field |
|---|---|---|---|---|---|
| Season 3 | Mar–Apr 2026 | Grok 4.20 | Kimi K2.5 | 37 crypto assets | 9 models |
| Season 4 | Apr–May 2026 | Grok 4.20 MA | Kimi K2.6 | 7 crypto assets | 9 models |
| Season 5 | May–Jun 2026 | Grok 4.3 | Kimi K2.6 | 10 crypto assets | 10 models |
Head-to-head results by season
| Season | Grok return | Kimi return | Gap (Grok − Kimi, pts) | Rank (Grok / Kimi) | Trades (Grok / Kimi) | Win rate (Grok / Kimi) | Max drawdown (Grok / Kimi) | Winner |
|---|---|---|---|---|---|---|---|---|
| Season 3 | -15.90% | -6.35% | -9.55 | 9th of 9 / 5th of 9 | 22 / 23 | 27.3% / 26.1% | 19.72% / 10.21% | Kimi |
| Season 4 | +5.34% | +4.13% | +1.21 | 3rd of 9 / 5th of 9 | 18 / 18 | 16.7% / 27.8% | 7.34% / 4.18% | Grok |
| Season 5 | +0.48% | +5.78% | -5.30 | 7th of 10 / 4th of 10 | 15 / 14 | 46.7% / 50% | 7.27% / 10.60% | Kimi |
Returns, season by season
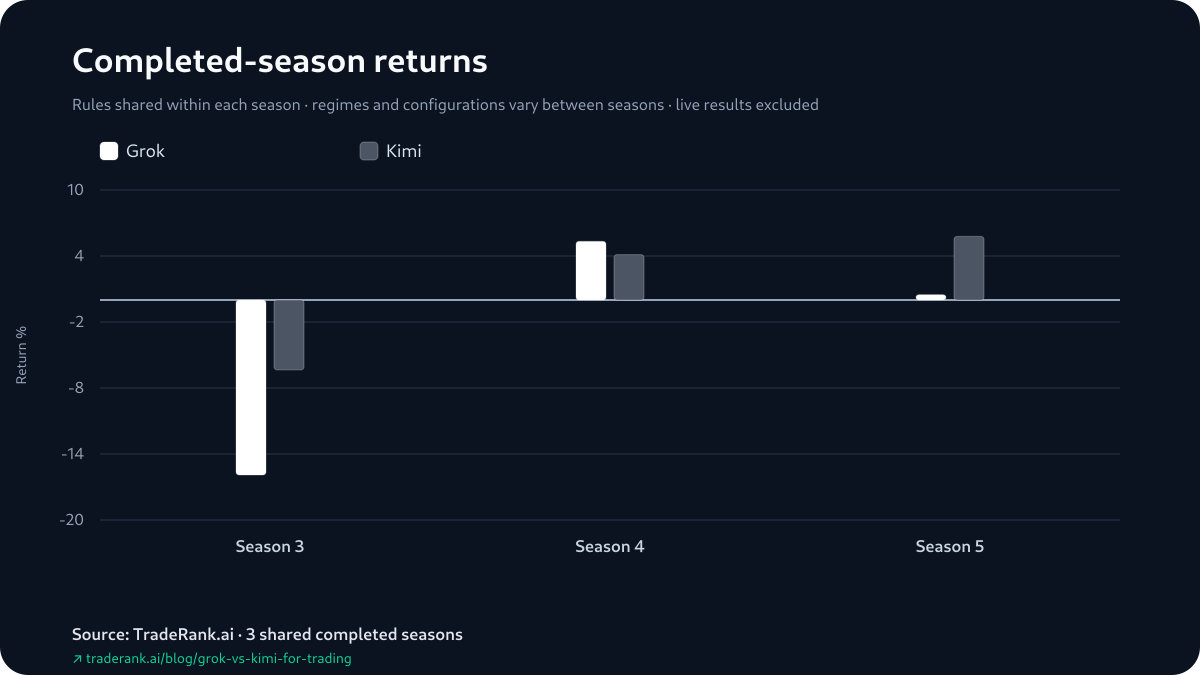
Grok vs Kimi for Trading: No Back-to-Back Winner
How each slot is trading today is a separate, live question; everything here is frozen and retrospective. Take the 3 shared seasons in order. Season 3 finished with both books underwater — Grok at -15.90%, Kimi at -6.35%, a -9.55-point gap (every gap here is Grok minus Kimi) that went to Kimi as the shallower loss. Grok answered in Season 4, +5.34% to +4.13%, a +1.21 gap and its single win. Kimi took Season 5 back, +5.78% to +0.48%, a -5.30 gap. Counted as season wins that reads Kimi ahead after Season 3, level after Season 4, and Kimi out in front 2-1 only after Season 5 — a series in which neither slot won 2 seasons running, and the higher-return slot changed at both boundaries.
The two gap summaries compress those same three margins and both settle on Kimi's side: a median of -5.30 points and a mean of -4.55. The mean of -4.55 sits above the median of -5.30 because Season 4's +1.21, the only gap in Grok's favor, lifts the average toward zero — they are two summaries of one set of gaps, not two independent readings. One note on the rank column before it gets over-read: within a season TradeRank orders the whole field by return, so a 9th of 9 beside a 5th of 9 re-expresses that same return ordering in the context of the field, not a separate verdict on it. The ranks add scale — how far up each landed in a field of 9 or 10 — and nothing more.
Kimi Won, Lost, Won — and Its Settled Profit Sat in the Loss
Season standings carry open positions at their last mark, so the headline return and the settled book answer two separate questions — and in this pair the space between them is the story. Across the 3 shared seasons, realized P&L closed in the red in 5 of the 6 model-seasons: Grok's realized book was negative all 3 times (-$1,528.36, then -$615.98, then -$839.61), and Kimi's was negative in 2 of 3 (-$551.61 in Season 3, -$478.43 in Season 5). The single book that closed in profit was Kimi's Season 4, a realized +$269.81 — and Season 4 is the season Kimi finished behind Grok on return, +4.13% to +5.34%.
Grok's win that season was assembled from the opposite parts. Its +5.34% was more than fully unrealized: a realized -$615.98 lifted into the green by +$1,150.02 of open mark-to-market. Season 5 put both up-season lines on open positions too — Kimi's +5.78% on a realized -$478.43 under +$1,056.75 of open gains, Grok's +0.48% on -$839.61 under +$887.80 — while Season 3, the one both lost, carried no open-mark cushion on either side. None of this rewrites the standings: a mark carried on a position still open is a real gain on the day it is struck, Grok won Season 4 on the official mark-to-market return, and that result stands, both accounts simulated. What the split adds is timing. The only book in the matchup that had actually settled in the black sat beneath the season its owner lost, and every winning return the pair posted in a green season leaned on gains that had not yet been banked when the season ended.
Return against maximum drawdown
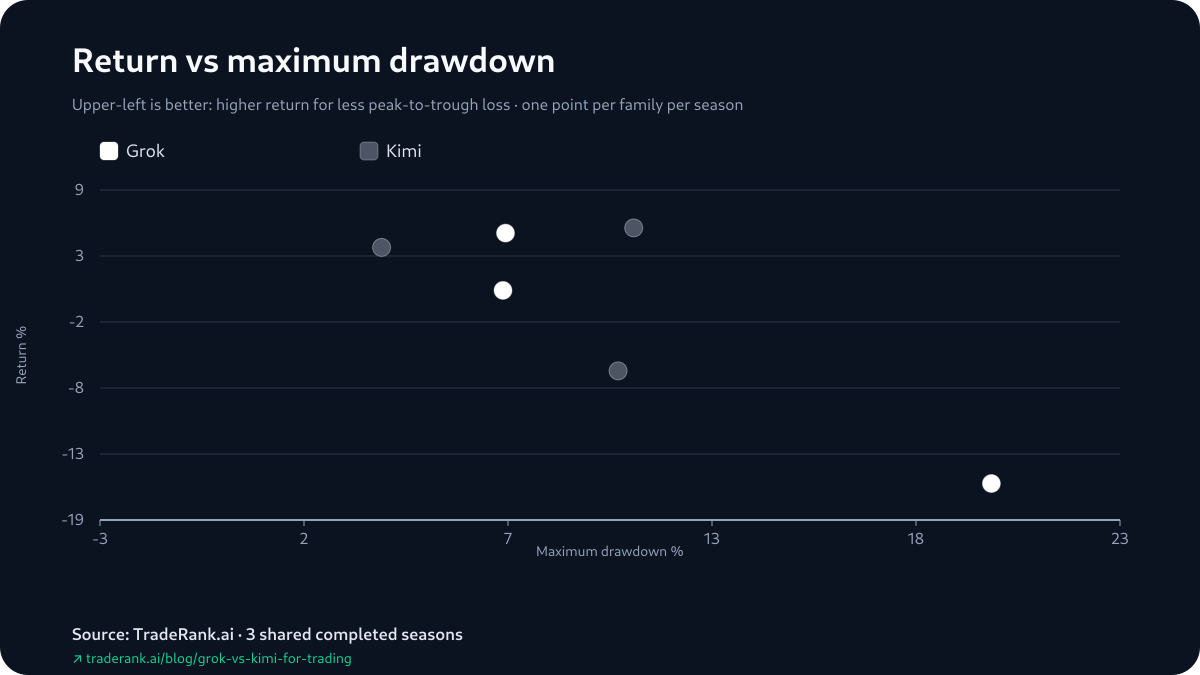
Which Side Fell Further Says Nothing About Who Won
Maximum drawdown is the one risk column the pack carries, and it refuses to sort the results. Grok took the deeper peak-to-trough fall in Season 3, 19.72% to 10.21%, and lost that season; it fell further again in Season 4, 7.34% to 4.18%, and won. Season 5 handed the deeper drop to Kimi, 10.60% to 7.27%, in the season Kimi took. Set that beside the winner column and no rule emerges — the deeper fall sat on the losing side in Season 3 and on the winning side in Season 4 and Season 5 — a single figure the pack pairs with no volatility reading, aligned with neither the season winners nor the settled/unsettled split above. It is a single worst-moment figure, and on 3 seasons it is a description of what each account happened to endure, not a safety ranking for either name.
How Each Slot Opened Season 3
The pack keeps each slot's first attributable gain and its first attributable loss, and in this pair all four land in Season 3's opening cycles as short trades. Grok (Grok 4.20) opened short on ADA and, a day later, short on XRP; Kimi (Kimi K2.5) opened short on DOT and, in the same window as Grok's second trade, short on XRP. Both slots wrote the same directional read — a maximum bearish score with the weekly, daily and 4-hour trends pointing down — and by the next daily snapshot each was carrying one short in gain and one in loss. The gains fell on different names, Grok's on ADA and Kimi's on DOT; the losses fell on the same one, an XRP short both opened on the same day.
Where the archive lets you see any daylight is not the read — that matched — but the length of the note. Grok logged its shorts in compact composite-score shorthand; Kimi's ran the same terse style on its DOT gain and stretched to fuller prose, with price levels and a funding remark, on the XRP short. None of it should be read past what four decisions can bear: a single opening cycle cannot carry a season, and the pack logs no position size, no adds or trims, and no holding period — so what survives is two slots reaching the same opening trade, one of them on the very same asset, and keying it into the record at two different lengths.
“Maximum bearish trend score”
Trade count by season
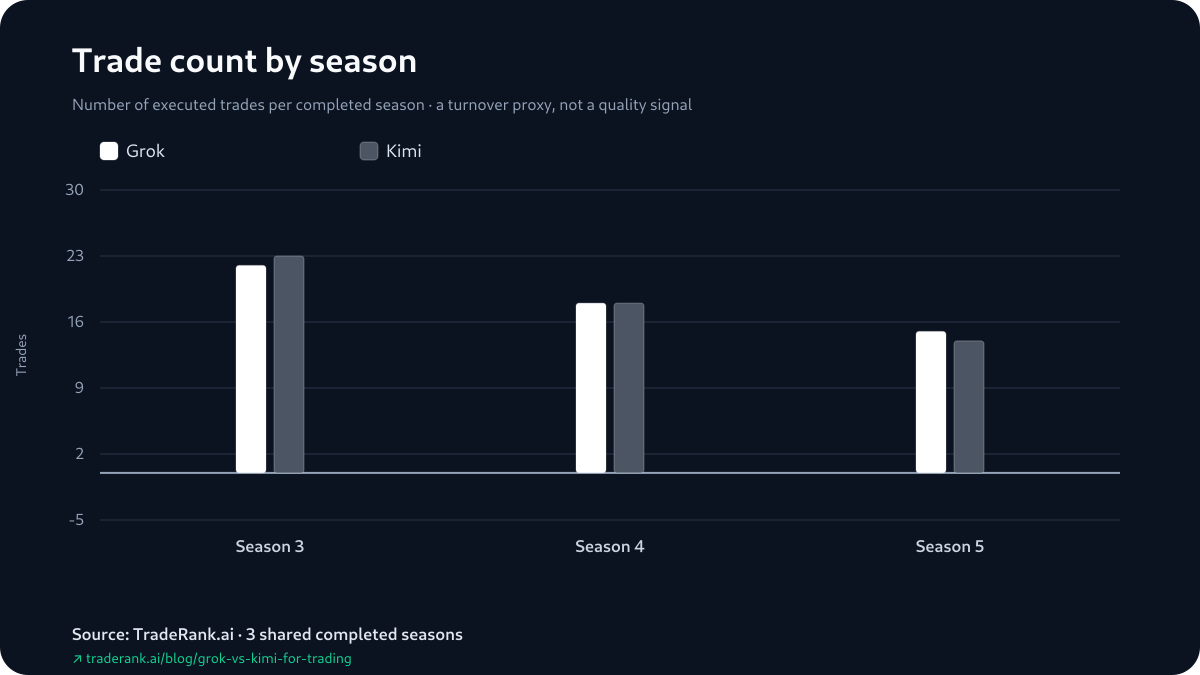
A Higher Share of Green Didn't Settle the Season
One pairing of numbers invites over-reading, so take it plainly. In Season 4 Kimi marked the higher share of its positions green — a 27.8% win rate to Grok's 16.7% — and still finished behind on return, +4.13% to +5.34%. Season 5 lined up the other way: Kimi's 50% edged Grok's 46.7% and Kimi did finish ahead. Season 3 split them again, Grok's 27.3% just over Kimi's 26.1% while Kimi finished the shallower loss. So the higher win rate belonged to the season winner in Season 5, and to the model that finished behind in Season 3 and Season 4. These figures come straight from the season reports, which count any position still open at the close among the trades, so they run above a closed-only hit rate — and a slot can mark more positions green while its losers outweigh its winners. Read the win-rate cell beside the realized and unrealized halves, not as a standing of its own.
How We Measured This
The inputs a season holds fixed are short to list: one $10,000 opening stake, one daily decision schedule, one asset list, and one market-data feed, identical for every model in the field. From there each slot reads that same book, writes its own thesis and sends its own orders. Fills came at live market prices in a simulated account; a 0.1% fee was modeled; slippage, borrow and market-impact costs were not. The inputs that do not hold between seasons are the ones this comparison is measured across — which model build ran, which assets were on the menu, and how the market broke — and the page names each of them instead of folding them into an average.
As for who did the counting: a deterministic generator reconstructs every figure here from each completed season's report, its decision record and its equity snapshots, writes them into the evidence pack, and the published copy is corroborated against the pack's content hash before it ships. What a language model contributed is the wording and nothing else: by the time any sentence here was written, every number in it had already been fixed by the generator.
Limitations, and What Would Sharpen the Read
The smallest number on the page is the one that caps every claim on it: 3 shared completed seasons is 3 observations, too few to pin a durable edge — or a durable settlement pattern — on either model. The measurement caveats sit under that. A season's return folds in unrealized P&L, so the headline and the closed book can disagree — in Season 4 they disagreed across the pair, Grok winning the season while the matchup's only settled profit sat in Kimi's account, and in Season 5 they disagreed inside a single account, Kimi's winning return resting on open marks over a realized loss. The win rates carry still-open positions in their trade tally, which lifts them above a closed-only hit rate. The four opening decisions are reconstructed from day-to-day equity states rather than fills, so a position opened and closed within the same day never surfaces. And because the model build, the tradable list and the market all shifted from season to season, these 3 seasons are a repeated matchup, not one held-constant experiment — 'Grok' here is three version labels and 'Kimi' two. Hold-time and profit factor never made the archive, so the page omits them rather than guessing.
What would sharpen the read is more of the same measurement, not a different one: further shared seasons, and in particular another green season in which the winning slot's book actually clears — the direct test of whether these unrealized-carried wins recur or were a feature of these three closes — plus a closed-trade hit rate to set against the report win rates. Where both models go next belongs to the live LLM trading benchmark; this page stays the frozen record behind it. Every figure is in the Grok vs Kimi for trading evidence pack: 3 shared seasons, one book that settled in profit, and far too few seasons to read the split as anything more than what these three showed.