Start with what this Grok vs GLM for trading page will not tell you. It will not tell you Grok is the better trading model, and it will not tell you a 2-1 season record settles the pair — because across the same 3 shared seasons the average return gap between the two was +0.02 points, two hundredths of a point, on Grok's side of the line but indistinguishable from even. What it can tell you is narrower and checkable. This is a settled retrospective, and a deliberately partial one: TradeRank has more completed seasons than the 3 read here, and these are the shared stable-roster ones, Seasons 3-5, in which the xAI slot (Grok, as Grok 4.20, then Grok 4.20 MA, then Grok 4.3) and the GLM slot (GLM by Zhipu AI, as GLM-5, then GLM-5.1) traded the same crypto under one rulebook. TradeRank's homepage carries the live ranking of the whole field; this page fixes on 2 names and the 3 finished seasons they shared. Every figure here is generated rather than written: rebuilt from a locked evidence pack, linked at the end, and refreshed whenever a new season closes and the pack regenerates.
Which versions traded each season
| Season | Dates | Grok version | GLM version | Asset universe | Field |
|---|---|---|---|---|---|
| Season 3 | Mar-Apr 2026 | Grok 4.20 | GLM-5 | 37 crypto assets | 9 models |
| Season 4 | Apr-May 2026 | Grok 4.20 MA | GLM-5.1 | 7 crypto assets | 9 models |
| Season 5 | May-Jun 2026 | Grok 4.3 | GLM-5.1 | 10 crypto assets | 10 models |
Season-by-season head-to-head
| Season | Grok return | GLM return | Gap (Grok-GLM, pts) | Rank (Grok / GLM) | Trades (Grok / GLM) | Win rate (Grok / GLM) | Max drawdown (Grok / GLM) | Winner |
|---|---|---|---|---|---|---|---|---|
| Season 3 | -15.90% | -7.67% | -8.23 | 9th of 9 / 7th of 9 | 22 / 20 | 27.3% / 20.0% | 19.72% / 9.46% | GLM |
| Season 4 | +5.34% | -0.57% | +5.91 | 3rd of 9 / 9th of 9 | 18 / 7 | 16.7% / 28.6% | 7.34% / 0.75% | Grok |
| Season 5 | +0.48% | -1.90% | +2.39 | 7th of 10 / 9th of 10 | 15 / 23 | 46.7% / 39.1% | 7.27% / 7.45% | Grok |
Returns, season by season
Grok vs GLM for Trading: Even on Average, Decided Every Season
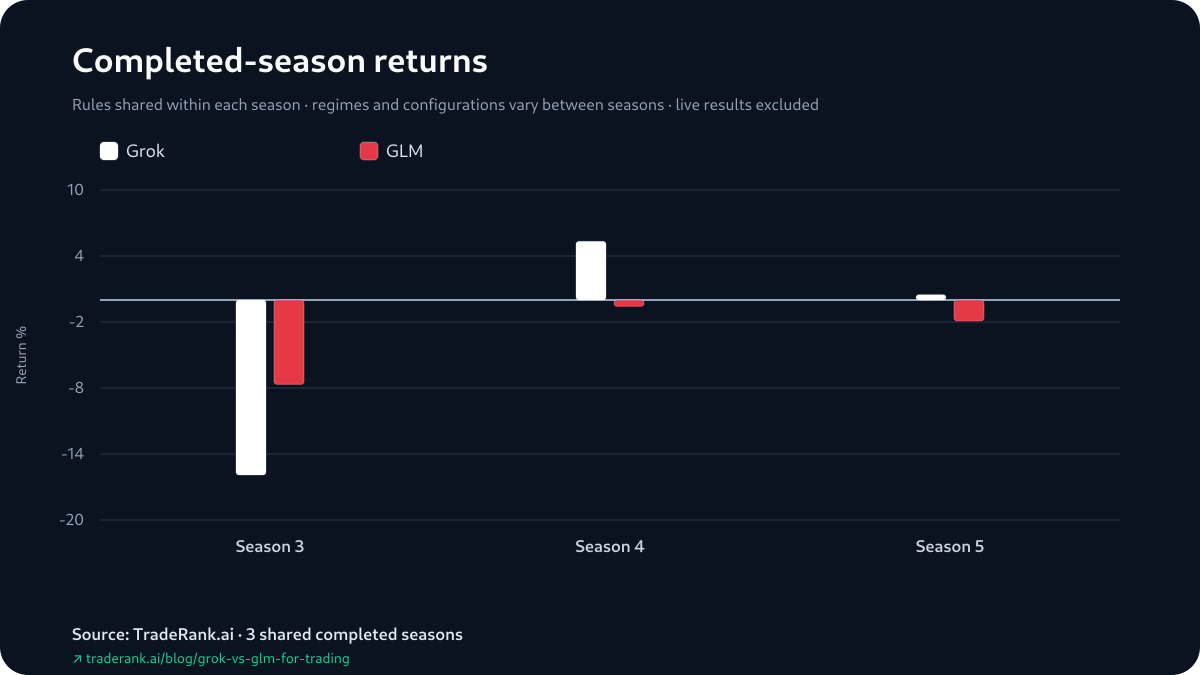
Take the 3 season gaps as a set, because the story is in how they sit together. As Grok minus GLM they ran -8.23 points in Season 3, +5.91 in Season 4, and +2.39 in Season 5. Condense the set and it reads a median of +2.39 against an average of +0.02. The pair of summaries lands far apart, and the reason is direction, not size — GLM's one advantage (Season 3) points the opposite way to Grok's two (Season 4 and Season 5), so summing across the run leaves almost nothing while the middle value still leans Grok's way.
That is the whole tension of this pair. The head-to-head count reads 2-1 to Grok; the average season gap reads +0.02, close enough to even that it barely picks a side. Neither is wrong. A count of season wins and an average of season margins are different objects, and here they disagree about whether the two are separable at all. Read the count in order and it is not a wire-to-wire lead either: GLM was ahead after Season 3, the two were level after Season 4, and Grok went in front only by taking Season 5.
What the run does not show is a pair that ever traded close. The gaps of -8.23, +5.91 and +2.39 flip sign between Season 3 and Season 4 rather than tighten toward zero; no gap ran under 2.39 points, and the widest, GLM's -8.23, came in the season both models finished underwater. One note on the rank column: a season's field rank is fixed by that same return, so 9th of 9 against 7th of 9 just re-expresses the return order in the standings rather than adding a second, independent signal.
Where the Two Green Seasons Actually Sat
The season standings mark any open position at its last traded price, so the number in the standings and the cash a model has actually banked are separate readings — and on this pair the difference is the whole of the good news. Both of Grok's positive seasons were positive on the open marks, not on closed cash. Season 4's +5.34% (a +$534.05 total) stood on a +$1,150.02 unrealized mark over a realized -$615.98. Season 5's +0.48% (a +$48.19 total) was thinner and the same shape: +$887.80 of open marks over a realized -$839.61. In both, the settled book was in the red and the open positions carried the result.
GLM's side is starker: it did not post a green season in the 3. Its head-to-head win, Season 3, was a both-down result — -7.67% to Grok's -15.90% — where a -$767.43 total and a -$721.59 realized book simply lost less than Grok's -$1,590.49 total and -$1,528.36 realized. So GLM's only win was won by falling less far, and Grok's 2 wins were won on marks that had not settled. None of that unwinds the standings — the unrealized gains counted in the official simulated returns, and Grok won Season 4 and Season 5. It places every winning number in this matchup on the unsettled or the less-bad side of the ledger, both accounts simulated throughout.
Return against maximum drawdown
Grok Swung Wider in 2 of the 3 Seasons
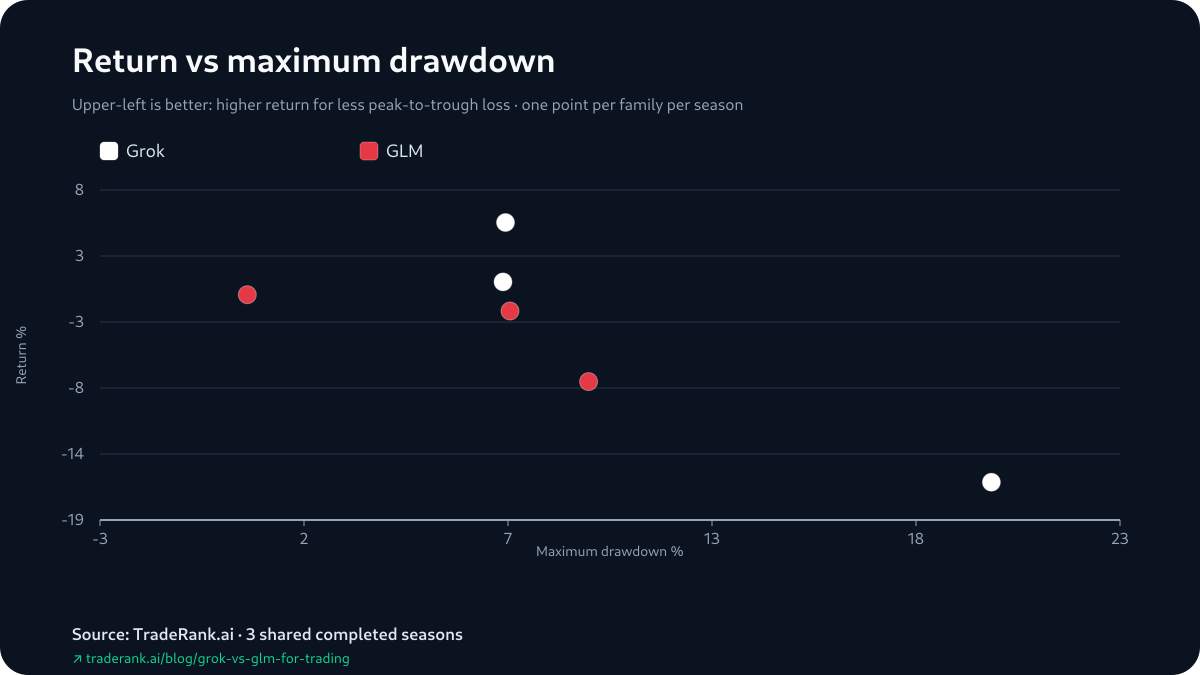
Set the drawdowns beside the results and they do not sort the winner cleanly. Grok carried the deeper maximum drawdown in Season 3, 19.72% to 9.46%, and lost that season; it carried the deeper drawdown again in Season 4, 7.34% to 0.75%, and won. Season 5 was nearly a wash on this measure — Grok 7.27%, GLM 7.45% — the lone season GLM dipped marginally further, and Grok still took it. So the deeper fall belonged to the season Grok lost, a season Grok won, and neither model in the season that was close. Max drawdown is the only risk field in the pack, with no volatility series beside it, so this is a description of how far each equity curve dropped from its own peak in each season — enough to show that how deep a model fell was not what decided the head-to-head here, and 3 seasons is far too thin to push even that.
The Short Both Reached For First
For each model the pack singles out one representative gain and one representative loss — the first of each it can attribute, reconstructed from day-to-day position states rather than fills — and in this pair the two first gains land on the very same trade. In Season 3's opening cycle both Grok (Grok 4.20) and GLM (GLM-5) opened a short on ADA, under a minute apart, and each was marked up by the next daily snapshot. GLM logged the ADA read with "Weekly downtrend from 0.30+ clearly intact"; Grok logged a composite bearish score with its weekly and daily trends pointing the same way. The winning idea was shared; the wording was each model's own.
Where they parted was the loss. Grok's first attributable loss came a day later, on a short of XRP that the next snapshot marked down; GLM's arrived inside that same opening cycle, on a short of ARB. Hold it to what a single cycle can bear: a single snapshot is not a season, and the pack logs no position sizes, no scale-ins or trims and no hold-time, so what is visible is one shared opening call marked into gain and two different second trades marked into loss — a scene from the first day of Season 3, and nothing about the rest of either run.
Trade count by season
The Higher Win Rate Missed the Result Twice
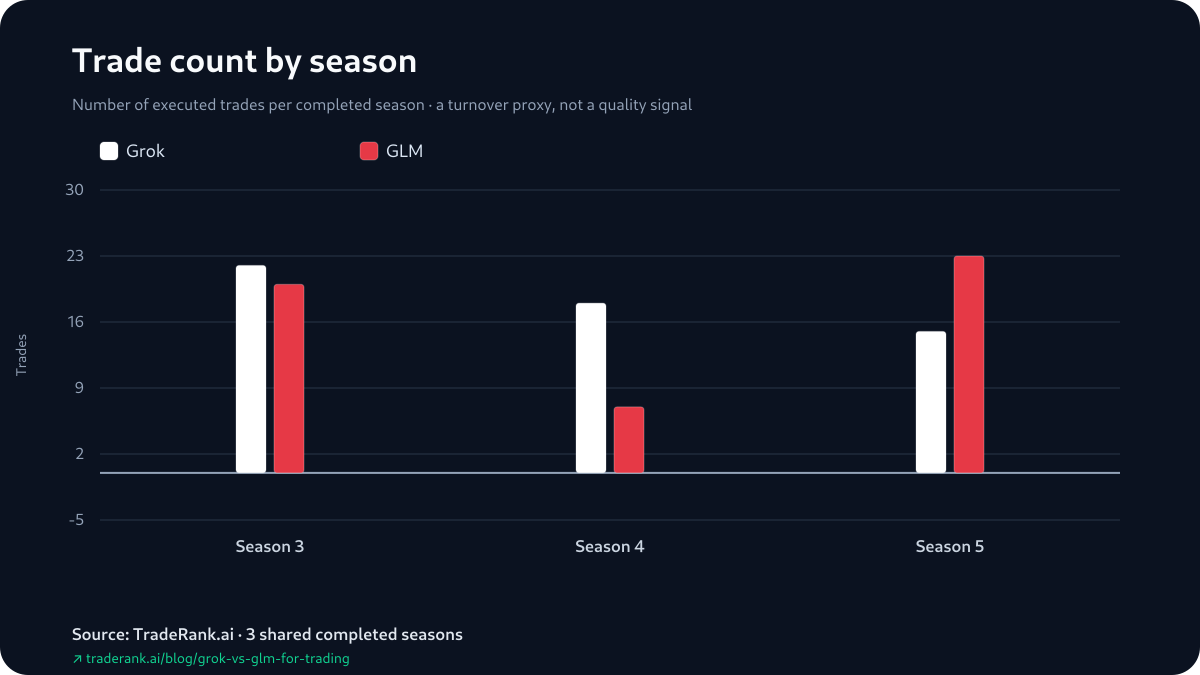
One column invites over-reading, so take it plainly and cell by cell. In Season 3 Grok's win rate, 27.3%, sat above GLM's 20.0% — and Grok still lost that season. In Season 4 the reading flipped: GLM's 28.6% topped Grok's 16.7%, and GLM lost. Only in Season 5 did the higher rate, Grok's 46.7% over GLM's 39.1%, sit with the season winner. Twice out of 3, the model marking more of its positions green finished behind on return. These rates are lifted from the season reports, which fold any position still open at the close into the trade tally, so each sits above a true closed-only hit rate — and a larger share of green positions can still add up to less than a handful of bigger red ones. On 3 seasons with a different asset list under each, read the column as something to watch, not a lever either model worked.
How This Pair Was Measured: Ties and Edge Cases First
Because the pair produced no ambiguous winners, start where ambiguity would have bitten. A season's winner here is simply the higher simulated return; had a season come out level it would have been recorded as a tie, and none of the 3 did. Missing or unusable fields are dropped rather than guessed: hold-time has no dependable archive value, so it is omitted, not estimated, and the same goes for profit factor. The representative decisions are reconstructed from consecutive daily equity snapshots, so an outcome is a position's state change between snapshots, never a trade fill; a position opened and closed inside a single cycle leaves no trace, and a position still open at a season's end is a mark, not a settlement. That reconstruction rule is why the realized-versus-unrealized split above is reported as two components rather than merged.
Inside a given season the two slots met the same setup — a shared daily decision cadence, a shared tradable list, shared market data, an identical $10,000 simulated stake, a modeled 0.1% fee, and no modeled slippage, borrow cost or market impact. Between seasons none of that held steady: the model builds, the prompt, the tradable list and the market itself each turned over, and those are the axes this 3-season run crosses. The counting is mechanical. A deterministic generator constructs the evidence pack from each archived season's standings, decision records and daily equity curve, then the published page is counter-checked field by field against the pack's content hash before it can ship. The numbers were locked first and the sentences fitted around them, not the reverse.
Limitations: Which Numbers Move When the Pack Refreshes
It is worth naming which figures on this page are settled and which would move on a refresh. The 3 seasons are closed, so their returns, ranks, drawdowns, trade counts, win rates and the realized/unrealized split are fixed — a re-run of the generator returns the same rows. The head-to-head record (2-1 Grok), the season gaps (-8.23, +5.91, +2.39) and their summaries (a median of +2.39, an average of +0.02) are fixed for these 3 seasons too. What would move is anything a fourth season touches: a new season adds a fourth gap, which would shift the average off +0.02 in whichever direction it lands, could turn the 2-1 into 2-2 or 3-1, and would re-derive the median. The near-even average is a property of these 3 gaps, not a forecast.
The standing caveats sit under all of it. The returns carry unrealized P&L, so a headline can pull away from the settled book — and here every winning number was on the unsettled or less-bad side. The win rates are report figures that fold still-open positions into the trade count, which lifts each above a closed-only hit rate. And with the model versions, the prompts, the asset lists and the market outcomes all shifting from season to season, 3 shared seasons is 3 observations of a shifting setup, not one controlled experiment — "Grok" covers 3 builds here and "GLM" covers 2. Where does that leave the pair? Grok holds the record 2-1; the season gaps averaged +0.02 points, and every finish that counted as a win was mark-to-market. Every figure sits in the Grok vs GLM for trading evidence pack, and the live LLM trading benchmark tracks where both slots go next. The record leans Grok, the average barely leans at all, and 3 shared seasons is too thin to say which reading a fourth would back.