One table on this page carries the whole verdict, so it is worth learning to read before the prose fills in around it. This Claude vs GLM for trading page lines up two autonomous trading slots — Claude, the Anthropic slot, against GLM, the model family from Zhipu AI (Z.ai) — across the 3 completed TradeRank seasons they shared a crypto rulebook, Seasons 3-5. In the head-to-head table below, one column settles the matchup: total season return, where Claude finished in front all 3 times. The columns sitting beside it — win rate, max drawdown, trade count — are context, and they do not simply repeat it. The win-rate column in particular ran higher for GLM in Season 3 and Season 4, and higher for Claude only in Season 5. Win rate and return are not independent checks on each other — they are two summaries of the same simulated account — and the space between them is what this page walks through. Scope first: it reads a closed 3-season slice, not TradeRank's full archive, and each badge covers two builds over the run (Claude Opus 4.6 then Claude Opus 4.7; GLM-5 then GLM-5.1). No figure here was written by a model — each is read straight out of a locked evidence pack (linked below) that our editorial pipeline rebuilds when a season is archived.
Which build sat behind each badge
| Season | Dates | Claude version | GLM version | Asset universe | Field |
|---|---|---|---|---|---|
| Season 3 | Mar-Apr 2026 | Claude Opus 4.6 | GLM-5 | 37 crypto assets | 9 models |
| Season 4 | Apr-May 2026 | Claude Opus 4.7 | GLM-5.1 | 7 crypto assets | 9 models |
| Season 5 | May-Jun 2026 | Claude Opus 4.7 | GLM-5.1 | 10 crypto assets | 10 models |
Head-to-head results by season
| Season | Claude return | GLM return | Gap (Claude-GLM, pts) | Rank (Claude / GLM) | Win rate (Claude / GLM; incl. still-open positions) | Max drawdown (Claude / GLM) | Trades (Claude / GLM) | Winner |
|---|---|---|---|---|---|---|---|---|
| Season 3 | -7.61% | -7.67% | +0.07 | 6th of 9 / 7th of 9 | 8.3% / 20.0% | 8.82% / 9.46% | 24 / 20 | Claude |
| Season 4 | +0.88% | -0.57% | +1.45 | 8th of 9 / 9th of 9 | 25.0% / 28.6% | 3.64% / 0.75% | 12 / 7 | Claude |
| Season 5 | +2.67% | -1.90% | +4.57 | 6th of 10 / 9th of 10 | 69.2% / 39.1% | 11.69% / 7.45% | 13 / 23 | Claude |
Season returns, side by side
Claude vs GLM for Trading: Reading the Return Column
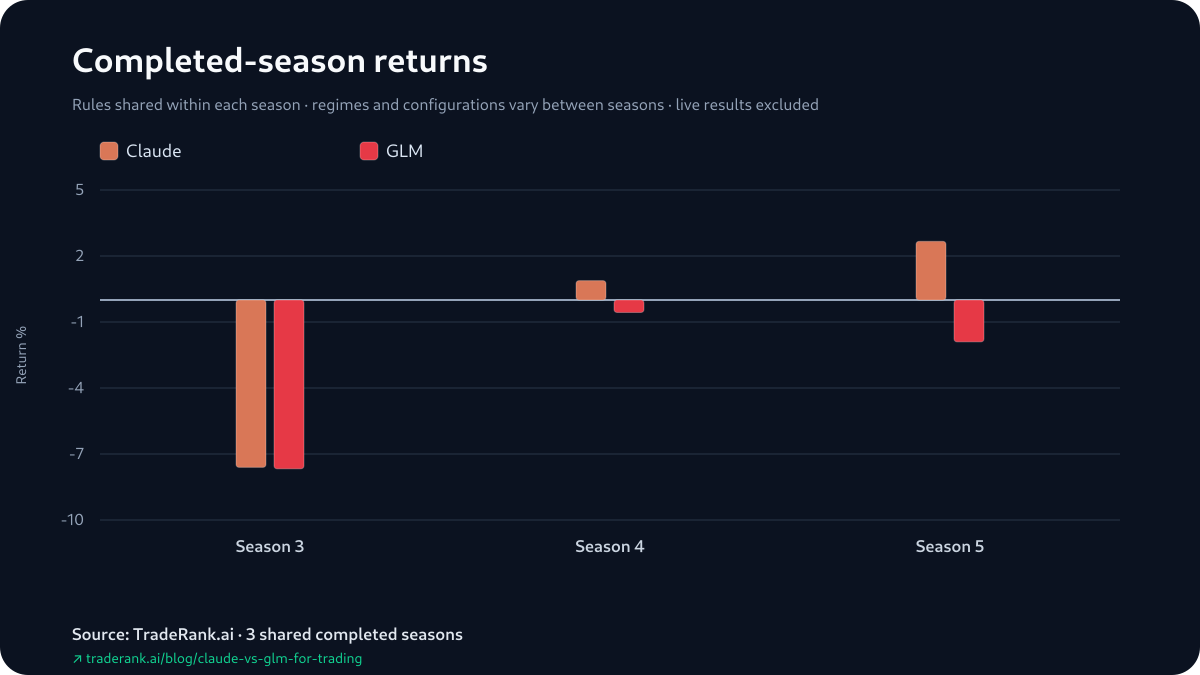
Take the return column top to bottom, because it is the one the head-to-head is scored on. Claude opened the run by edging Season 3, -7.61% against GLM's -7.67%, the season both books ended underwater and the closest of the three — a +0.07-point gap (every gap here is Claude minus GLM). It kept Season 4, +0.88% to -0.57%, and Season 5, +2.67% to -1.90%. Counted in sequence, Claude was in front after Season 3, still in front after Season 4, and in front once more after Season 5 — a 3-0 line built from the opener, with no season handed back.
The gaps behind the record ran +0.07, +1.45, +4.57; the median is +1.45 points and the average +2.03, both drawn from the same 3 gaps rather than confirming them independently. The one place the return column reads cleaner than the rest of the table is direction: GLM's three finishes were -7.67%, -0.57% and -1.90%, none of them above zero, while Claude's crossed into green in Season 4 and Season 5. On 3 seasons, with a different asset list and a different market under each, that is a sequence to describe rather than a slope to extend.
One caution on the rank column beside the returns: a model's field placing is a direct function of that same return, so 6th of 9 against 7th of 9 restates the return order in the context of the whole field rather than confirming it on its own.
The Win-Rate Column Ran the Other Way
Set the win-rate column against the results it sits beside. Win rate — the fraction of a model's positions sitting in the green — was higher for GLM in Season 3 and again in Season 4, both seasons GLM lost on return, and higher for Claude only in Season 5. In Season 3 GLM marked 20.0% of its positions up to Claude's 8.3%, and finished narrowly behind on return, a +0.07-point gap to Claude. In Season 4 GLM was higher again, 28.6% to 25.0%, and again finished behind. Season 5 put both columns on the same side for the first time: Claude at 69.2% to GLM's 39.1%, in the season Claude's return margin was widest.
How much weight the column carries is a separate question from what it shows. These win-rate figures come from the season reports, and a position that was still open when the season ended counts in them — a different statistic from a closed-only hit rate, so the boundary travels with the number. What the record itself says is narrow: the higher share of green positions sat with GLM in Season 3 and Season 4, the seasons themselves went to Claude both times, and the first season in which the higher win rate and the higher return belonged to the same model was the last one.
Return against maximum drawdown
The Winner Took the Deeper Drop in Two of the Three
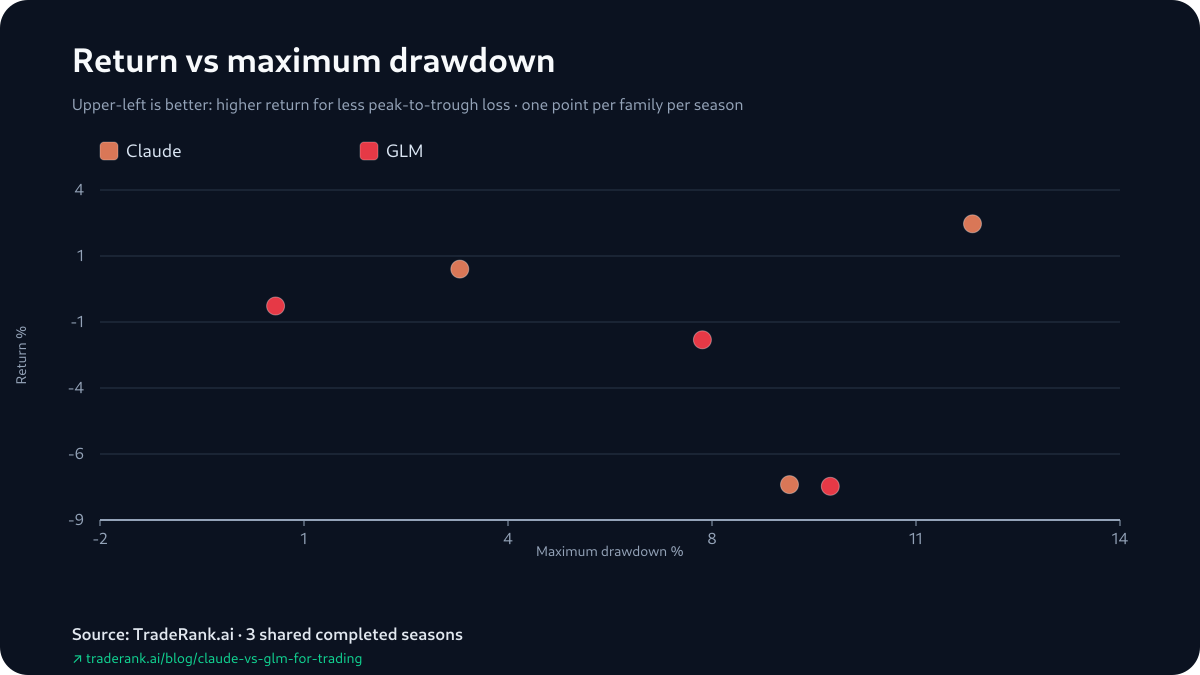
Set the drawdowns next to the results and they cut against the tidy reading that the model in front simply risked less. Claude won every season, yet in Season 4 and Season 5 it carried the deeper peak-to-trough loss — 3.64% to GLM's 0.75%, then 11.69% to 7.45% — including the season it won by the most. Only in Season 3 did the deeper drop sit with GLM, 9.46% to 8.82%, and that was the season the return gap was thinnest. So maximum drawdown, the single risk figure archived here, belonged to the eventual loser once and to the eventual winner twice; it does not sort these seasons the way the return column does. Read it as one worst-moment number per model, with no volatility series beside it to fill in the shape between.
Where the Green Actually Settled
The season standings mark open positions at their last price, so a headline return and a booked profit are two different figures, and the pair splits on that difference. GLM never cleared zero on the surface, and underneath the seasons ran both ways: its least-negative result, Season 4's -0.57%, was a small booked loss of -$65.46 under +$8.54 of open marks, for a -$56.92 total; its -1.90% in Season 5 held +$297.85 of open gains over a booked -$488.16, netting -$190.32. Claude's greens split too — the +0.88% in Season 4 was a booked -$369.85 lifted by +$458.12 of open marks, while the +2.67% in Season 5 ran the other way, a booked +$324.41 with a -$57.40 mark against it. And Season 3, the closest season on returns, sat close on the books as well: a -$760.69 total for Claude against -$767.43 for GLM. None of that reorders the head-to-head — the official simulated returns stand — but it says the settled and the open halves of each number answer different questions, on both simulated accounts.
Trade count by season
The First Cycle Both Slots Read the Same Way
For each slot the pack surfaces one early gain and one early loss it can tie to a specific decision, and in Season 3's opening window both came in from the same read. Claude (Claude Opus 4.6) and GLM (GLM-5) each came in short, and each of their first marked gains was a short on ADA — both slots reading a downtrend lined up across the weekly, daily and shorter charts, and both catching that ADA short in the green by the following snapshot. Where they parted was on the second name: Claude's featured loss was a short on UNI, GLM's a short on ARB, each drifting the other way by the next mark.
GLM logged its ARB short in clipped terms — a "Strong bearish trend alignment" tag on a downtrend it called intact — while Claude wrote the same style of setup out in longer prose. Hold it to what a single cycle can carry: two openings apiece cannot explain a season, and the pack records no position sizing, no adds or trims, and no holding period. What is visible is a shared opening read on the same first asset, entered by both slots, and it says nothing about the weeks that actually settled each season.
How This Page Was Measured, With No Judgment Call
Start with where discretion enters, because the short answer is that it does not. No human, and no language model, picked the winners, rounded the returns or chose which cells to show: a deterministic generator walks each finished season's report, its decision log and its equity snapshots, and reads out every value shown here, one run yielding the same rows as the next. Within a season the two slots ran on matched terms: one daily decision window, one tradable list, one live market feed, and a $10,000 simulated stake apiece, with orders filled at live prices under a modeled 0.1% fee and slippage, borrow costs and market impact left out. Between seasons nothing was held fixed: prompts, model builds, the asset list and the market all moved, which is why the 3 seasons are a repeated matchup rather than one controlled trial.
The hand-off to prose is deliberate. The generator produces the evidence pack and a content hash for it; the published page is then tested against that hash before it ships, so the writing is arranged around locked numbers and never the reverse. Where both slots stand in the ongoing competition is a separate, moving question tracked on the live LLM trading benchmark; everything here is frozen.
Limitations: What the Generator Refuses to Claim
It helps to name the claims the tooling refuses to let this page make. It will not call GLM the safer trader for holding shallower drawdowns in the two later seasons, because drawdown is one worst-moment figure with no volatility series behind it, and here it belonged to the eventual winner twice and the loser once. It will not turn GLM's higher win rate into a better-trader verdict, because the reports count still-open positions in that rate and GLM lost the seasons anyway. It will not read a booked profit as the real winner, because the official return is the simulated mark-to-market and both accounts were simulated alike. And it will not stretch 3 seasons into a trend: the builds changed (Claude Opus 4.6 then 4.7; GLM-5 then GLM-5.1), the asset universe changed, and the openings are reconstructed from day-to-day position states rather than fills, so any same-cycle round-trip leaves no trace. Hold-time carries only a placeholder in the reports and profit factor is not archived, so both are left out rather than guessed. What is left is a described 3-season slice: Claude ahead on return all 3 times, GLM ahead on win rate in Season 3 and Season 4. The cells behind every sentence here sit in the Claude vs GLM for trading evidence pack — check them there rather than taking this page's word for any of them.