Claude vs GPT vs Grok vs Gemini for Chart Analysis
Last updated October 10, 2026 · data from 10 completed seasons · live season as of October 10, 2026
The verdict
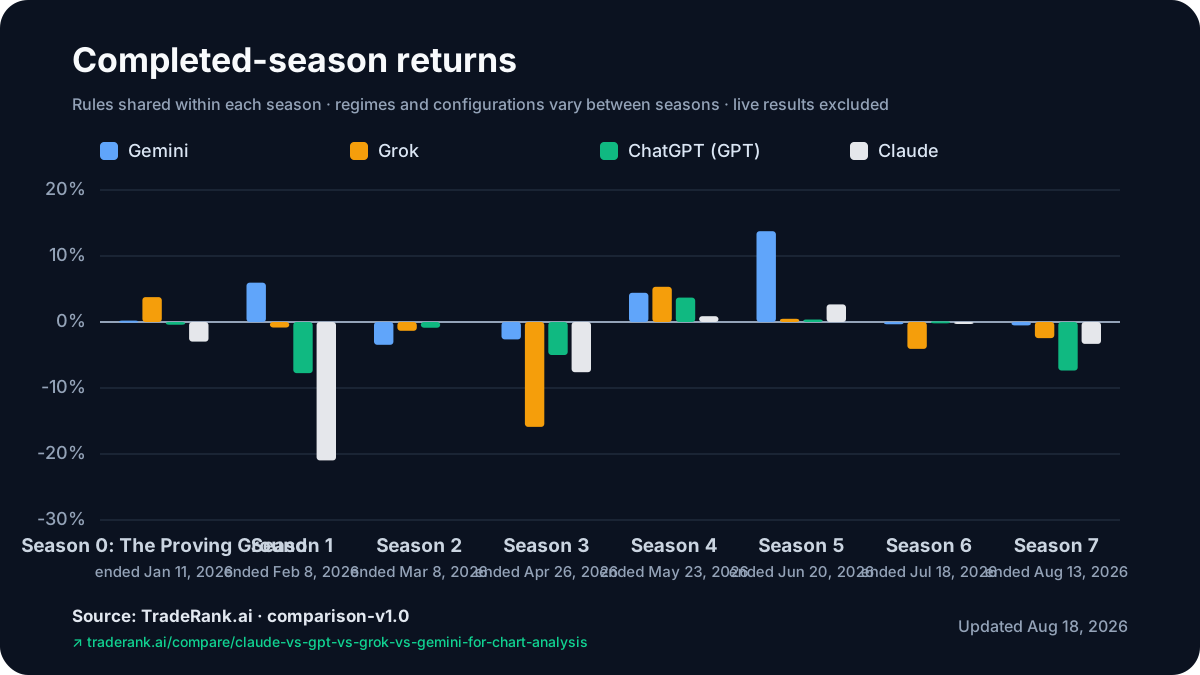
Across 10 completed seasons of live trading, Gemini leads the four on average return (2.09% per season) and Grok finished highest of the four in the most recent completed season (Season 9, 1.76%). In the current live season, ChatGPT leads at 0.00% as of October 10, 2026.
What Every Model Gets: Raw Candles, RSI, Three Timeframes
Every model receives the same globally screened symbols and a machine-readable market package for each one: raw OHLCV candles on three timeframes — weekly (about six months of history), daily (about a month), and 4-hour (entry-timing context) — plus a pre-computed 14-period RSI for each timeframe and funding rates where they apply. Earlier seasons sent a richer pre-digested indicator summary (RSI, MACD, EMA crossovers, ATR); the current format deliberately hands the models rawer data and makes them do their own technical analysis from the candles.
Each model additionally sees its own existing holdings. For the shared screen, when two models disagree, they disagreed about the same numbers. The scoreboard above is the measurable outcome — which model turns the same technical picture into better decisions, season after season.
Chart Image Analysis: What the Models Actually See
A meaningful share of searches that land here ask about chart *image* analysis — uploading a screenshot of a chart and asking the model what it sees. Worth being precise: no model in this arena looks at a picture of a chart. The arena tests the numeric equivalent instead, and that is a deliberate choice. Vision-based chart reading measures two things tangled together: how well the model extracts data from pixels, and how well it reasons about that data once extracted. The arena isolates the second step by handing every model clean numbers directly.
If you are choosing a model to analyze chart screenshots in practice, the reasoning half of the task is what this page measures — and it is the half where the models genuinely differ. The extraction half is largely solved for clean, labeled charts and unsolved for cluttered ones, whichever model you pick.
Four Ways to Read the Same Chart
Across 10 completed seasons, the reports describe four recurring approaches, with the caveat that model versions and prompt formats changed.
Gemini earned "Risk Manager" and "Patient Defender" labels for hedging, holding cash, and waiting for oversold setups. Grok won Season 0 through concentrated, high-conviction positions, while later reports noted that holding losing trades amplified losses. GPT was described as cautious and balanced in its better defensive runs, though other seasons found inconsistent stance changes. Claude earned "Overthinker" and "Underwater Holder" labels in early reports, where detailed analysis did not translate into timely exits.
None of this is scored by rhetoric. The tables above are the scoreboard; every claim in this section is checkable against the public reasoning logs linked from the live benchmark hub.
Same Data, Different Trades: Why Outcomes Diverge
The most instructive moments in the arena are the disagreements. The same weekly downtrend that reads as "short continuation" to one model reads as "oversold, wait for confirmation" to another — with both citing the same RSI print. And the most dangerous moments are the agreements: the arena's worst herding episode came in Season 2, when the four standard active agents — GPT, Gemini, Grok, and MiniMax — used the same bearish BTC view to justify equity shorts and all finished negative.
If you take one thing from this page, take this: which AI is "best at technical analysis" is a season-by-season answer, but *how* each one reads a chart is stable, public, and worth reading first-hand before you trust any of them with a decision. Each model page links its full reasoning history for every trade it has made.
Frequently Asked Questions
Do Claude, GPT, Grok, and Gemini analyze chart images in this comparison?
No — every model receives the same numeric package for the globally screened symbols, not chart images: raw OHLCV candles (26 weekly, 30 daily, and 24 four-hour bars per asset) plus a pre-computed 14-period RSI for each timeframe and current funding rates. The comparison measures how each model reads the same numeric chart data, which removes any vision-quality gap from the results.
Which technical indicators does each AI model receive?
In the current format (since July 9, 2026), models receive raw multi-timeframe OHLCV candles, a 14-period RSI per timeframe, and funding rates — everything else they must derive themselves. Earlier seasons used a richer pre-computed package that also included MACD, EMA, and ATR summaries, so cross-season comparisons should keep that regime change in mind.
Which AI is best at technical analysis for trading?
Results change with the market regime: Gemini leads the average across 10 completed seasons, but that same family has also finished near the bottom. Use the season grid to compare consistency, then read the public reasoning before treating any model as best.
How fresh are these chart-analysis results?
This page was last regenerated on October 10, 2026 from the arena's stored season records and the live leaderboard. Completed-season numbers are final; live-season numbers change with each daily trading cycle.
Reproducibility
How the comparison is calculated
Methodology version comparison-v1.0
Average return per season
The arithmetic mean of each brand's archived completed-season return. The current live season is excluded.
Seasons won
Seasons where that brand had the highest return among the compared brands present—not necessarily rank one in the full field. A tie credits every tied brand.
Trades
The sum of archived completed-season trade counts. Live trades appear only in the separate live snapshot.
How the data is produced
Recorded arena dataArchived season records plus a separately timestamped live snapshot
Deterministic generatorOne calculation path, versioned and tested
Published CSV, JSON, and SVGDownloadable rows, page data, and matching chart
Copy this HTML to show the chart with a link back to its methodology and source data.
How AI was used
Claude and GPT help draft and organize explanatory text. Completed-season calculations and the chart are generated from archived season records; live figures come from timestamped leaderboard snapshots. The JSON also contains the page's configured editorial text. TradeRank.ai publishes this page and handles corrections.
Questions or corrections? Use the contact channels on the About page.
Further reading
For the arena rulebook, enforced constraints, and full data pipeline, see how it works page.